


The article “Gold, the Golden Constant, COVID-19, “massive Passives,” and Déjà Vu” first appeared on Alpha Architect Blog.
- Claude Erb, Campbell R. Harvey, Tadas Viskanta
- A version of this paper can be found here.
- Want to read our summaries of academic finance papers? Check out our Academic Research Insight category
The world has unquestionably be sent on a wild ride in 2020. We entered the year full of optimism and hope. Markets were at or near all-time highs, unemployment was low, living on easy street was good. Then the impact of COVID-19 ripped through the market and the economy with enough force to make the winds of even a double hurricane green with envy. This massive and rapid readjustment of the economy sent the Federal Reserve and the Federal Government into a frenzy of money printing that has reached altitudes that even the team at Alpha Architect wouldn’t want to hike at. Market observers and armchair macro-economists minds start firing with thoughts of the Weimaraner republic, and wheelbarrows of Deutch Marks needed for even small routine purchases. To quell these fears the first place people turn is to gold 1. With gold approaching all-time highs, even on inflation-adjusted terms, we must ask if it’s a good inflation hedge. The authors of this paper pull on the string of gold as an inflation hedge by utilizing gold futures prices, CPI data, and other metrics to answer this question.
What are the research questions?
- How well has gold been as an inflation hedge in the past?
- If gold is not an inflation hedge, can it still go higher?
What are the Academic Insights?
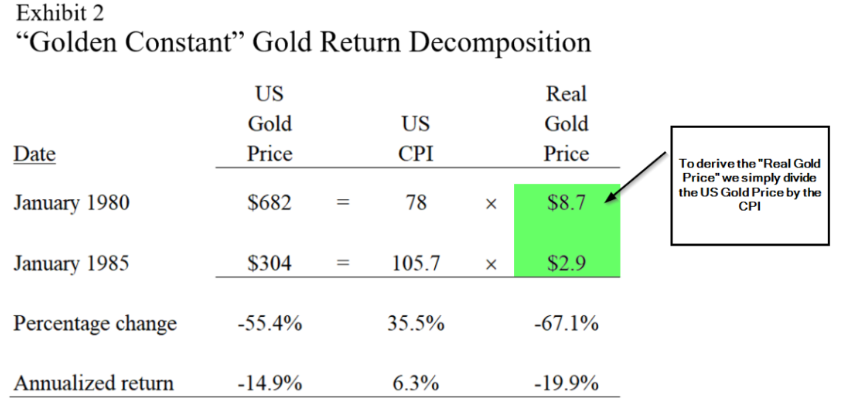
- Since 1975, when gold futures started trading, gold has not performed well as an inflation hedge. Historically gold prices rise in as the anticipation of inflation rises, but when that inflation does arrive (or doesn’t as in 2011) the real returns of gold have been abysmal. January of 1985 marked a peak in gold prices of $682 an ounce, while the CPI was at 78. Over the following 5 years, gold fell to $304 per ounce (a -55.4% return), while the CPI rose to 105.7(a 35.5% increase). The real gold price from 1980 to 1985, a period marked by relatively high 6.3% annualized inflation, saw gold prices fall 67.1% (-19.9% annualized). 2011 was a slightly different story as the expected high inflation never materialized. From gold’s peak in August 2011 to August 2016 the nominal price of gold fell 28% and the real price of gold fell 33%.
- Yes, the authors point towards the expanded use of ETF’s to bring investors aka “massive passives” into the gold market. They argue that the widespread utilization of gold ETF’s could potentially create Keynesian demand-pull inflation, where too much money is chasing too little gold. These massives passives investors are fed on higher prices and in the author’s opinion higher gold prices beget higher prices in a virtuous cycle that can take gold prices to levels never seen before.
Why does it matter?
Gold is again at a peak valuation and inflation expectations are high. So, it’s a critical time to look at the past and consider that as Buffett succinctly puts it:
“Price is what you pay, value is what you get.”
-Warren Buffett
The authors argue that if the high prices of gold, due to high levels of concern for inflation, did not reward high inflation fears in 1980 and 2011, why should it do so now? The data they provide is compelling and gives a good balance to the inflation fear-mongering that is fairly easy to rationalize when such extreme initiatives are being taken by the federal government. One concern I have with the paper is that the sample size of two price spikes and utilizing such limited data sets to draw conclusions leaves a bit more uncertainty. Maybe we can entice Jamie Catherwood to take a deeper dive into the history of gold and it’s performance over a much longer time period in history. That said the paper presents a wide breadth of ways to analyze and think about gold as an investment and is a great read for educational benefit alone.
There is little doubt that “massive passive” investors in markets can derive some very extreme price swings, note oil trading at -$35 a barrel. In any event, it is prudent to be aware that price volatility and valuation increases well beyond even “high prices” is possible, even with the conclusion that gold has not been a wonderful inflation hedge over the last 40 years.
The most important chart from the paper
Note: Bloomberg data (tickers GCI Comdty, CPI INDX Index).
The results are hypothetical results and are NOT an indicator of future results and do NOT represent returns that any investor actually attained. Indexes are unmanaged, do not reflect management or trading fees, and one cannot invest directly in an index.
Abstract
Currently, the real, inflation-adjusted, price of gold is almost as high as it was in January 1980 and August 2011. Since 1975, periods of high real gold prices have occurred during periods of elevated concern about high future price inflation. Five years after the real price peaks in January 1980 and August 2011 the nominal (real) prices of gold fell 55% (67%) and 28% (33%), respectively. Today’s high real price of gold suggests that gold is an expensive inflation-hedge with a low prospective real return. However, “massive passive” ETF financialization of gold ownership may introduce a period of “irrational exuberance”.
Notes:
- If you’re younger and wiser maybe you turn to cryptocurrencies. ↩
Disclosure: Alpha Architect
The views and opinions expressed herein are those of the author and do not necessarily reflect the views of Alpha Architect, its affiliates or its employees. Our full disclosures are available here. Definitions of common statistics used in our analysis are available here (towards the bottom).
This site provides NO information on our value ETFs or our momentum ETFs. Please refer to this site.
Disclosure: Interactive Brokers
Information posted on IBKR Campus that is provided by third-parties does NOT constitute a recommendation that you should contract for the services of that third party. Third-party participants who contribute to IBKR Campus are independent of Interactive Brokers and Interactive Brokers does not make any representations or warranties concerning the services offered, their past or future performance, or the accuracy of the information provided by the third party. Past performance is no guarantee of future results.
This material is from Alpha Architect and is being posted with its permission. The views expressed in this material are solely those of the author and/or Alpha Architect and Interactive Brokers is not endorsing or recommending any investment or trading discussed in the material. This material is not and should not be construed as an offer to buy or sell any security. It should not be construed as research or investment advice or a recommendation to buy, sell or hold any security or commodity. This material does not and is not intended to take into account the particular financial conditions, investment objectives or requirements of individual customers. Before acting on this material, you should consider whether it is suitable for your particular circumstances and, as necessary, seek professional advice.
Disclosure: Bitcoin Futures
TRADING IN BITCOIN FUTURES IS ESPECIALLY RISKY AND IS ONLY FOR CLIENTS WITH A HIGH RISK TOLERANCE AND THE FINANCIAL ABILITY TO SUSTAIN LOSSES. More information about the risk of trading Bitcoin products can be found on the IBKR website. If you're new to bitcoin, or futures in general, see Introduction to Bitcoin Futures.