


The post “How to Measure and Understand Portfolio Tail Risk Events” first appeared on Alpha Architect Blog.
- Arnold Polanski, Evarist Stoja, Frank Windmeijer
- Journal of Applied Econometrics, 2019
- A version of this paper can be found here.
- Want to read our summaries of academic finance papers? Check out our Academic Research Insight category
What are the Research Questions?
To any investor that has had the opportunity to experience a large collapse in the market, they can tell you that essentially there is nowhere to hide. Correlations of assets that were held to diversify a portfolio suddenly get very correlated in extreme market conditions aka the tails of the distribution. Much academic research has been done on the “stronger dependence” 1 that prevails among assets during turbulent times has been so well established, highlighting it is now laboring the point. What has been more challenging was measuring it for portfolios of more than a few assets – the very few observations in the tails compound the challenges posed by a large number of assets. This paper proposes a way to measure such dependence in the tails for a large number of assets in a portfolio using the following simple observations. Under independence, tail events, i.e. extreme losses of some assets do not convey any information about tail events of other assets. Conversely, tail dependence is defined as a situation where the tail events of a set of assets are informative about such events for other assets. Statistical procedures are then developed to study the tail dependence across assets and over time.
What are the Academic Insights?
The authors analyze the daily returns of the 250 constituents of the Standard & Poor 250 index (S&P250). Prices and capitalization of each constituent have been obtained from Datastream between 02 January 1990 and 29 December 2017 (7, 057 daily observations). They use a number of return series for the analysis: (i) raw returns, (ii) AR(1)-GARCH(1,1)-standardised returns (to account for heteroskedasticity which can distort dependence measures), (iii) the residuals of the regression of raw returns on the Fama-French-Carhart factors.
Some important findings are:
- The tail dependence of the assets of this large-cap portfolio displays a rotated-J shape – it is largest when the market is under extreme duress, lower under market exuberance, and lowest under day-to-day events (i.e. moderate gains and losses).
The five largest positive contributors to tail dependence in the portfolio are utility stocks while the largest negative contributions are IT stocks.
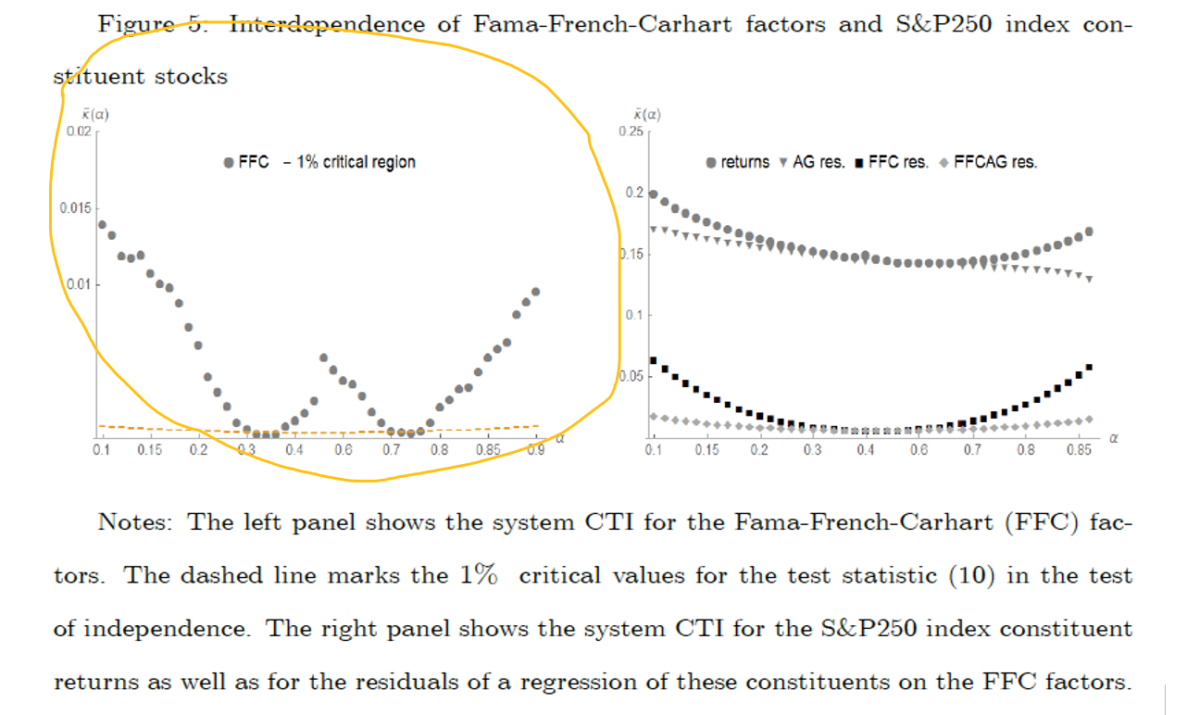
- Most of the dependence in the portfolio returns are explained by the market index while the other Fama-French-Carhart asset pricing factors account for very little of the dependence.
- The inability of the Fama-French-Carhart factors to account for the dependence of the portfolio returns in the tails is a direct manifestation of the tail dependence of the factors themselves – the Fama-French-Carhart factors are virtually independent in the central part of their joint distribution but strongly dependent in the tails.
Why does it matter?
Accounting for asymmetric tail dependence is essential for many applications such as hedging and portfolio diversification. In particular, the standard advice to hold a well-diversified portfolio is questionable if assets are independent in the central part of the joint distribution but tend to fall significantly in value as one of them experiences an extreme drop, thereby further compounding large losses instead of offsetting them.
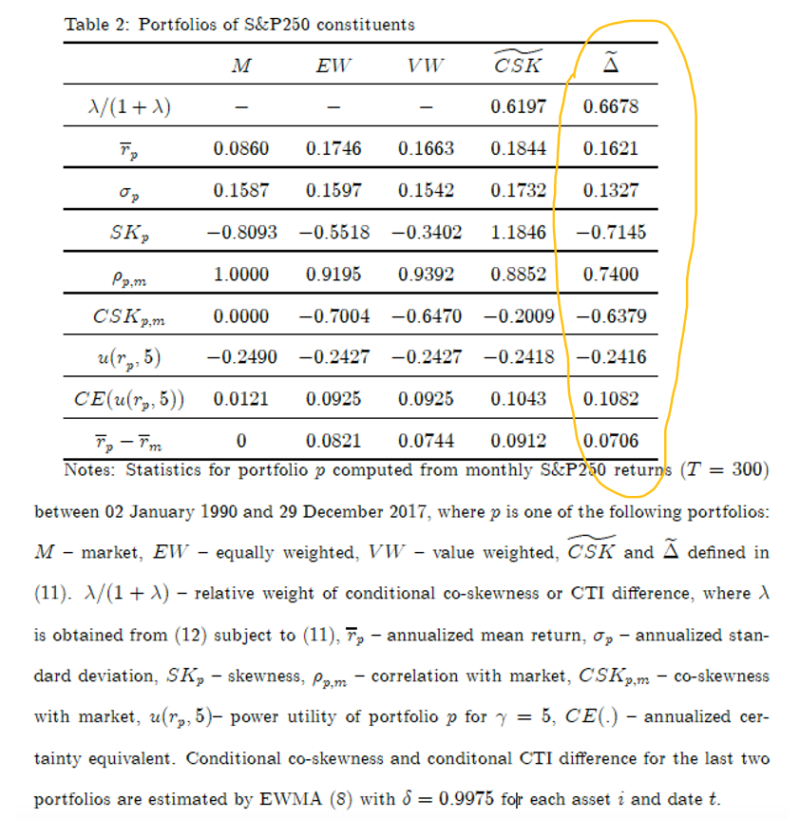
The authors examine the performance of two portfolios that exploit the asymmetry of the joint distribution of returns captured by either co-skewness or the coefficient of tail dependence and find that “co-skewness-managed” portfolio has the highest return whereas the “tail-risk-managed” portfolio has the lowest risk relative to the alternative models they use.
The Most Important Chart/Table from the Paper:
The results are hypothetical results and are NOT an indicator of future results and do NOT represent returns that any investor actually attained. Indexes are unmanaged, do not reflect management or trading fees, and one cannot invest directly in an index.
The results are hypothetical results and are NOT an indicator of future results and do NOT represent returns that any investor actually attained. Indexes are unmanaged, do not reflect management or trading fees, and one cannot invest directly in an index.
Abstract
We propose a simple and flexible framework that allows for a comprehensive analysis of tail interdependence in high dimensions. We use co-exceedances to capture the structure of the dependence in the tails and, relying on the concept of multi-information, define the coefficient of tail interdependence. Within this framework, we develop statistical tests of (i) independence in the tails, (ii) goodness-of-fit of the tail interdependence structure of a hypothesized model with the one observed in the data, and (iii) dependence symmetry between any two tails. We present an analysis of tail interdependence among 250 constituents of the SP250 index
Notes:
- Dependence refers to the relationship between two random variables whereas interdependence refers to the relationship among two or more variables. Hence, the latter concept nests the former.
Disclosure: Alpha Architect
The views and opinions expressed herein are those of the author and do not necessarily reflect the views of Alpha Architect, its affiliates or its employees. Our full disclosures are available here. Definitions of common statistics used in our analysis are available here (towards the bottom).
This site provides NO information on our value ETFs or our momentum ETFs. Please refer to this site.
Disclosure: Interactive Brokers
Information posted on IBKR Campus that is provided by third-parties does NOT constitute a recommendation that you should contract for the services of that third party. Third-party participants who contribute to IBKR Campus are independent of Interactive Brokers and Interactive Brokers does not make any representations or warranties concerning the services offered, their past or future performance, or the accuracy of the information provided by the third party. Past performance is no guarantee of future results.
This material is from Alpha Architect and is being posted with its permission. The views expressed in this material are solely those of the author and/or Alpha Architect and Interactive Brokers is not endorsing or recommending any investment or trading discussed in the material. This material is not and should not be construed as an offer to buy or sell any security. It should not be construed as research or investment advice or a recommendation to buy, sell or hold any security or commodity. This material does not and is not intended to take into account the particular financial conditions, investment objectives or requirements of individual customers. Before acting on this material, you should consider whether it is suitable for your particular circumstances and, as necessary, seek professional advice.