


The post “Lottery Preferences and Their Relationship with Factor Investing” first appeared on Alpha Architect Blog.
Among the assumptions in the first formal asset pricing model, the CAPM, is that investors are risk-averse, they maximize the expected utility of absolute wealth, and they care only about the mean and variance of return. However, research has found that these assumptions don’t hold. In the real world, there are investors who have a “taste,” or preference for lottery-like investments— investments that exhibit positive skewness and excess kurtosis. This leads them to irrationally (from a traditional finance perspective) invest in high volatility stocks (which have lottery-like distributions) despite their poor returns—they pay a premium to gamble. If the markets were perfectly efficient, arbitrageurs would enter the market and drive prices to their right level. However, in the real world, limits to arbitrage, and the costs and fear of shorting, can prevent rational investors from correcting mispricings.
Lottery-like distributions have been found in IPOs, “penny stocks,” extreme high beta stocks, small growth stocks with low profitability and high investment, and financially distressed stocks that are either in or near bankruptcy. The preference for lottery-like payout distributions has been found in other areas, not just in the world of investing. For example, the authors of the study “Do Investors Overpay for Stocks with Lottery-like Payoffs?” noted that when it comes to horse racing, long shots are systematically overvalued. Longshots, defined as bets with 1/100 or worse odds of winning, a $1 bet has an average payoff of just $0.39. The average payoff to favorites, by contrast, is $0.95.
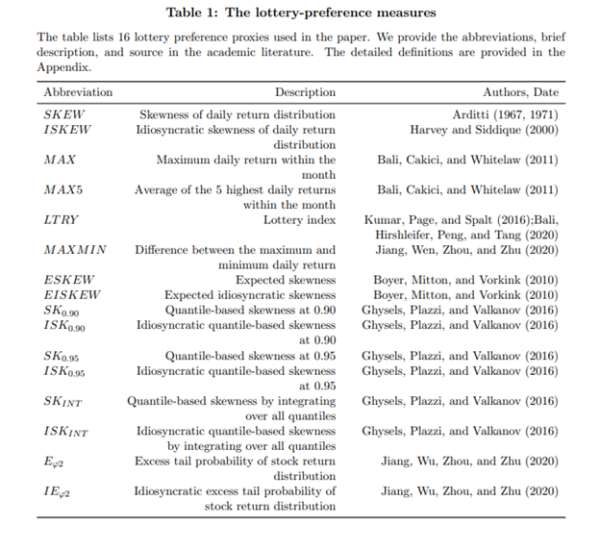
The literature contains 16 measures of a lottery preference including skewness, expected skewness, maximum daily return, and return asymmetry.
Latest Research on Lottery Preference and Factors
Lei Jiang, Quan Wen, Guofu Zhou, and Yifeng Zhu contribute to the literature on the lottery preference with their June 2020 study “Lottery Preference and Anomalies.” They aggregated information on the 16 measures of lottery preference into a single factor and examined its performance in explaining anomalies to the Fama-French five-factor (beta, size, value, profitability, and investment) model and the four-factor (beta, size, investment, and profitability) q-model of Hou, Xue, and Zhang (read more about it here). Their study covered the period from January 1980 to December 2018.
Source: original paper
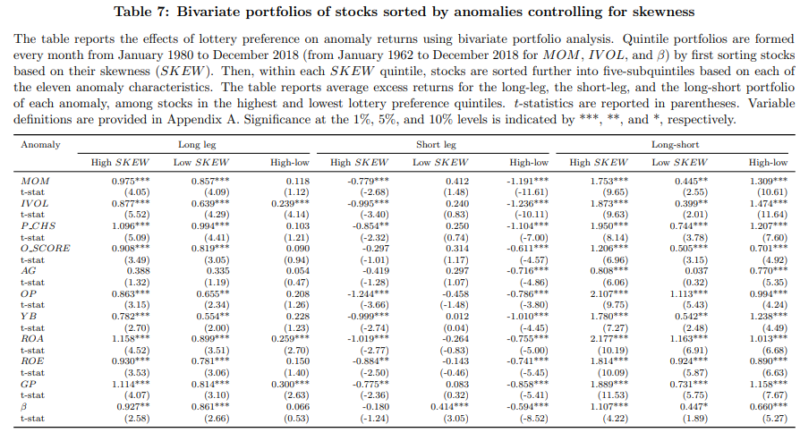
They first formed quintile portfolios every month by first sorting stocks based on lottery preference. Then within each lottery preference portfolio, stocks were further sorted into sub-quintiles based on each of the firm characteristics of the eleven anomalies.
Following is a summary of their findings:
- All 16 individual lottery proxies are positively correlated with total skewness.
- The excess return spreads and alphas between the low- and high-skew portfolio range from −0.31% to −0.34% per month and are statistically significant.
- Using the lottery proxy of the maximum daily returns, negative monthly alphas were in the range of −1.08% to −1.36%.
- Stocks with more lottery preference are smaller in size, have lower book-to-market ratios (are growth stocks) and higher momentum, and are more illiquid, and have higher market beta than stocks with lower lottery preference.
- The economic significance of anomalies depends crucially upon lottery preference. The behavioral-motivated lottery factor adds significant explanatory power to commonly-used factor models—there is a strong relation between lottery preference and 11 well-known anomalies.
- Return-related anomalies such as stock momentum, idiosyncratic volatility, and the beta premium, are significantly stronger among stocks in the highest lottery preference quintile compared with stocks in the lowest lottery preference quintile.
- Fundamental-related anomalies such as financial distress, asset growth, and profitability (e.g., operating or gross profitability) are also much stronger among stocks with high lottery preference.
- The significant anomaly returns are mainly driven by the short leg of the anomalies among stocks with high lottery preference— the average returns of the long leg of the 11 anomalies are generally not significantly different between high- and low-lottery preference stocks.
- Over the period from July 1978 to December 2018, the average monthly return of the combined lottery factor is 1.81% per month, with a standard deviation of 2.08%, and has the highest Sharpe ratio of 0.87 compared to other factors.
- The mechanism of lottery preference affecting anomaly returns can also be related to short-sale constraints which prevent arbitrageurs from correcting mispricings—stocks with high lottery features have lower short sale volumes on average and investors are reluctant to short sell stocks with high lottery features, which exacerbates the mispricing of lottery stocks.
Conclusion
Their findings led the authors to conclude:
“Our results indicate that the main driving force of the anomaly returns is the underperformance of short-leg among stocks with high lottery preference… “The empirical evidence indicates that lottery preference matters and the behavioral-motivated lottery factor is of value to be included into the major asset pricing models, above and beyond the commonly used factors.”
Fund families whose investments strategies are based on academic research, such as Alpha Architect, AQR, Bridgeway, and Dimensional Fund Advisors, have long excluded stocks with lottery characteristics from their eligible universe. (Full disclosure: My firm, Buckingham Strategic Wealth, recommends AQR, Bridgeway, and Dimensional funds in constructing client portfolios.)
Disclosure: Alpha Architect
The views and opinions expressed herein are those of the author and do not necessarily reflect the views of Alpha Architect, its affiliates or its employees. Our full disclosures are available here. Definitions of common statistics used in our analysis are available here (towards the bottom).
This site provides NO information on our value ETFs or our momentum ETFs. Please refer to this site.
Disclosure: Interactive Brokers
Information posted on IBKR Campus that is provided by third-parties does NOT constitute a recommendation that you should contract for the services of that third party. Third-party participants who contribute to IBKR Campus are independent of Interactive Brokers and Interactive Brokers does not make any representations or warranties concerning the services offered, their past or future performance, or the accuracy of the information provided by the third party. Past performance is no guarantee of future results.
This material is from Alpha Architect and is being posted with its permission. The views expressed in this material are solely those of the author and/or Alpha Architect and Interactive Brokers is not endorsing or recommending any investment or trading discussed in the material. This material is not and should not be construed as an offer to buy or sell any security. It should not be construed as research or investment advice or a recommendation to buy, sell or hold any security or commodity. This material does not and is not intended to take into account the particular financial conditions, investment objectives or requirements of individual customers. Before acting on this material, you should consider whether it is suitable for your particular circumstances and, as necessary, seek professional advice.