


The post Machine Learning Classification Methods and Factor Investing appeared first on Alpha Architect Blog . Below is an excerpt.
In the last post in our machine learning series, we showed how nonlinear regression algos might improve regression forecasting relative to plain vanilla linear regression (i.e., when underlying reality is nonlinear with complex interactions).
In this piece, we’ll first review machine learning for classification, a problem which may be less familiar to investors, but fundamental to machine learning professionals. Next, we’ll apply classification to the classic value/momentum factors (spoiler: the results are pretty good).
An Introduction to Classification Algorithms
What Is Classification?
In this post:
- We’ll break down a classification example “Barney-style” with Python code.
- We’ll present a high-level overview of classification algorithms.
- Finally, in part 2, we’ll apply classification to a portfolio to generate an investment strategy by classifying expected returns by quintile.
From classification, it’s a short step to deep learning problems like handwriting recognition, or image labeling. Classification is a fundamental building block that enables machine learning to perform incredible feats.
Classification essentials
We start (code is here) by generating random data with two predictors (the x-axis and y-axis) and a variable with two labels (red or blue). The numbers are generated from a truncated normal with [0,100] bounds (see here for details).
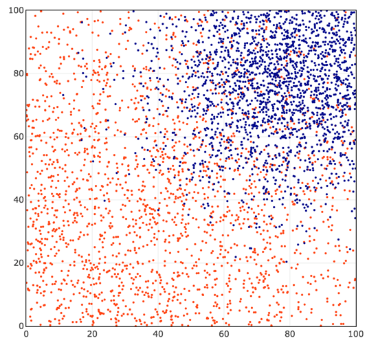
2000 red dots are centered around x = 25, y = 25 with a standard deviation of 50, and assigned label = 0.
2000 blue dots are centered around x = 80, y = 80 with a standard deviation of 20, and assigned label = 1.
We would like to find a function that takes the coordinates x and y, and returns an accurate prediction of 0 (blue) or 1 (red).
Logistic regression is a simple, popular classification algorithm.
Here are the basics of how it works:
- Apply a linear decision function of x and y that outputs a numeric variable:

- Apply a sigmoid ‘squashing’ function to Z that maps large positive numbers to a probability estimate close to 1, and large negative numbers to a probability close to 0.
- Apply a loss function that measures prediction error. The loss should be close to 0 when the prediction is close to 1 for the blue observations (label=1); and also close to 0 when the prediction is close to 0 for the red observations (label=0).
- Finally, find the parameters a, b, c of our linear function that minimize the loss function.
If we can train our classifier so its average loss is near zero, we will obtain good matches between our predictions and observed values.
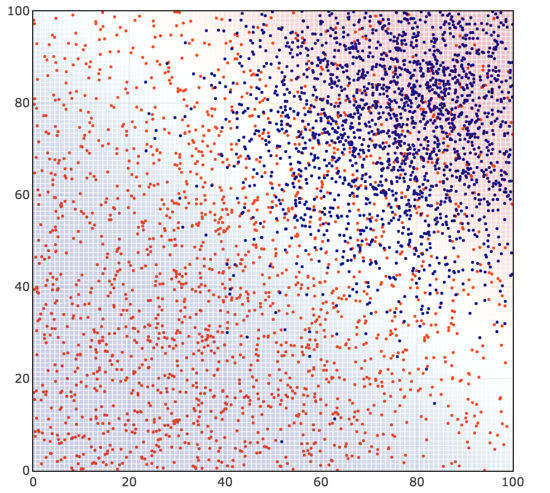
We find a, b, and c that minimize the loss via gradient descent: choose random starting values for a, b, c, determine in which direction they need to be updated to reduce the total loss over all training observations, and iteratively update a, b, and c until we find values that achieve a minimum loss.
We obtain a classification (blue/red shading) that looks like this:
Now, let’s look a little more closely at the math behind these four steps. (If you’re not into the math, you can skip down, but it’s not very difficult, and after all Alpha Architect is a quant finance blog!)
Decision function: ![]() is proportional to the Euclidian distance from (x, y) to the line defined by
is proportional to the Euclidian distance from (x, y) to the line defined by ![]() . It represents how far a point is from the decision boundary, the classification margin.
. It represents how far a point is from the decision boundary, the classification margin.
Disclosure: Alpha Architect
The views and opinions expressed herein are those of the author and do not necessarily reflect the views of Alpha Architect, its affiliates or its employees. Our full disclosures are available here. Definitions of common statistics used in our analysis are available here (towards the bottom).
This site provides NO information on our value ETFs or our momentum ETFs. Please refer to this site.
Disclosure: Interactive Brokers
Information posted on IBKR Campus that is provided by third-parties does NOT constitute a recommendation that you should contract for the services of that third party. Third-party participants who contribute to IBKR Campus are independent of Interactive Brokers and Interactive Brokers does not make any representations or warranties concerning the services offered, their past or future performance, or the accuracy of the information provided by the third party. Past performance is no guarantee of future results.
This material is from Alpha Architect and is being posted with its permission. The views expressed in this material are solely those of the author and/or Alpha Architect and Interactive Brokers is not endorsing or recommending any investment or trading discussed in the material. This material is not and should not be construed as an offer to buy or sell any security. It should not be construed as research or investment advice or a recommendation to buy, sell or hold any security or commodity. This material does not and is not intended to take into account the particular financial conditions, investment objectives or requirements of individual customers. Before acting on this material, you should consider whether it is suitable for your particular circumstances and, as necessary, seek professional advice.