


Performance and risk metrics are widely used to evaluate the performance of a stock or portfolio, and forms a major component of portfolio management. In this blog, we will try to touch upon some important portfolio and risk metrics that can provide you with a clear view of your investment’s performance and risk.
The first part of the article looks at such commonly used performance metrics that give us an insight into the anatomy of a trading strategy. In the second part of the article, we will cover some important metrics for risk management in an investment or a portfolio. The final part explains strategy optimisation for your portfolio in brief with a simple example.
- Why do we need portfolio risk management?
- What are performance and risk metrics?
- Types of performance metrics and their calculation
- Absolute risk-adjusted measures
- Relative return measures
- Types of risk metrics and their calculations
- Absolute risk measures
- Relative risk measures
- Tail risk measures
- How to measure trading performance of a portfolio?
- What is strategy optimisation?
- An example of strategy optimisation
Why do we need portfolio risk management?
The performance of a portfolio of assets is measured with a set of parameters.
For example, if you are trading in equity then your returns are compared against the benchmark index. The consistency of returns of the portfolio also proves to be a significant factor.
But returns alone cannot measure the success or failure of a portfolio. In finance, risk and return are considered to be two sides of the same coin. You can’t have one without the other.
Therefore, identifying and analysing the risk undertaken in your investment is a crucial step while evaluating and optimising your trading strategy.
When asked what the stock market will do, Benjamin Graham said, “It will fluctuate”.
There is no sweeping method by which one can predict the exact movement of the market direction. Hence, it is important that we make use of multiple risk and performance metrics while making investment decisions.
What are performance and risk metrics?
A key lesson for portfolio risk management is that returns mean nothing unless we put them side by side with the risk undertaken. Performance and risk metrics do just that.
Performance and risk metrics are statistics we use to analyse our trading strategy. They can help determine:
- how well your trading strategy performs,
- how robust it is, and
- if it will survive in different market conditions.
We use these metrics to get a better understanding of an investment’s return by measuring how much risk is involved in producing that return.
Let’s now look at some useful performance and risk management measures to help you evaluate your investment portfolio.
Types of performance metrics
The various types of performance metrics are as follows:
- Absolute risk-adjusted measures
- Relative return measures
Absolute risk-adjusted measures
Sharpe ratio
Sharpe Ratio measures the average return earned in excess of the risk-free rate per unit of volatility or total risk i.e., standard deviation.
In other words, the ratio describes how much profit you receive for the extra volatility you endure for holding a riskier asset. Sharpe ratio is one of the most popular metrics among investors to measure portfolio performance.
Remember, you need compensation for the additional risk you take by not holding a risk-free asset.
Formula and calculation for Sharpe ratio
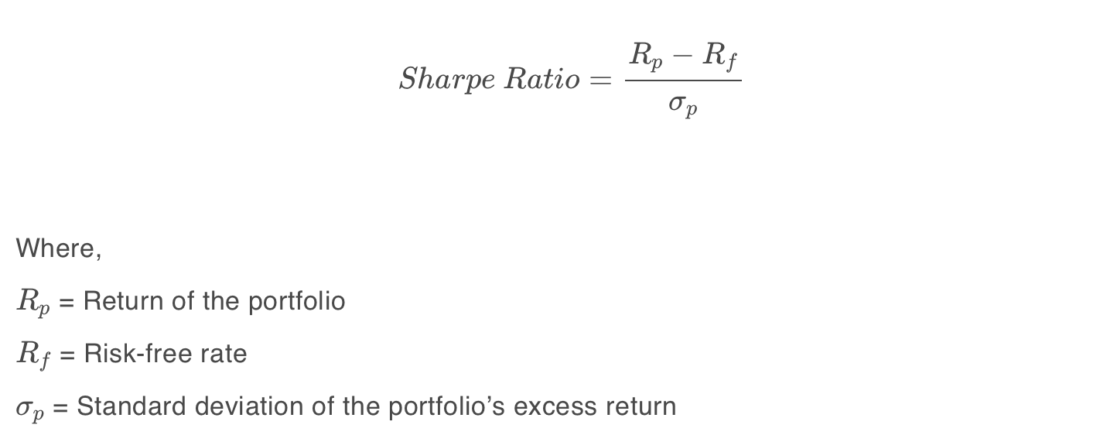
Sharpe ratios greater than 1 are preferable, as it means your returns are greater given the risk you are taking. So generally, the higher the ratio, the better the risk to return scenario for your portfolio.
Sortino ratio
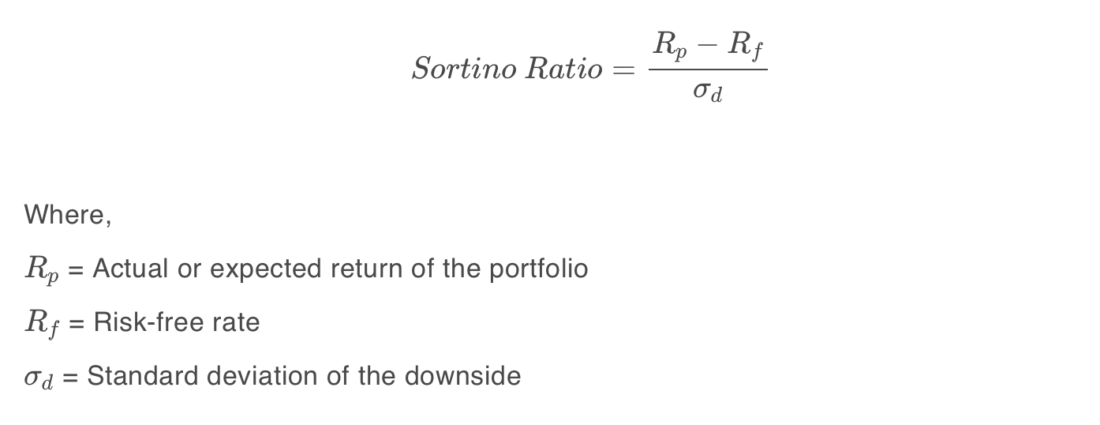
Sortino ratio is a modified version of the Sharpe ratio that differentiates harmful volatility from the overall volatility. It is calculated by estimating the excess portfolio return over the risk-free return relative to its downside deviation (i.e. standard deviation of negative asset return).
In addition to focusing only on portfolio returns that fall below the mean, the Sortino ratio is thought to offer a better representation of risk-adjusted performance since positive volatility is a benefit. Like Sharpe ratio, a higher value of Sortino ratio indicates less risk relative to return.
Formula and calculation for Sortino ratio
Calmar ratio
Calmar Ratio also called the Drawdown ratio is calculated as the Average Annual rate of return computed for the latest 3 years divided by the maximum drawdown in the last 36 months.
The higher the ratio, the better is the risk-adjusted performance of an investment fund such as hedge funds or commodity trading advisors (CTAs) in the given time frame of 3 years.
Formula and calculation for Calmar ratio
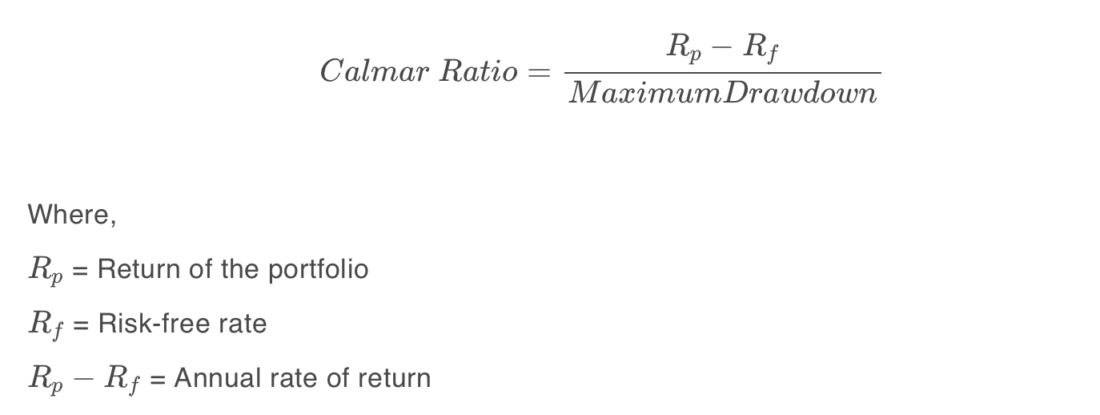
The annual rate of return shows how a fund has performed over a year. The maximum drawdown is characterised as a maximum loss from peak to trough over a given investment period.
It is determined by subtracting the fund’s lowest value from its highest value and then dividing the result by the fund’s peak value.
Relative return measures
Up capture ratio
The Up capture ratio measures a portfolio’s return with respect to the benchmark’s return.
It is used to analyse the performance of a portfolio during bull runs, i.e. when the benchmark has risen. A ratio greater than 100 indicates that the portfolio has outperformed the index.
Formula for Up capture ratio
The up capture ratio is calculated by dividing the portfolio’s returns by the returns of the index during the bullish trend and multiplying that factor by 100.

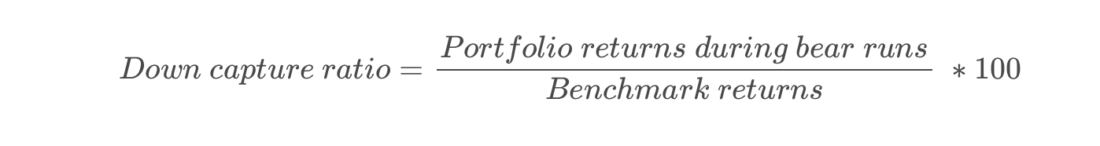
Down capture ratio
A statistical measure that measures the portfolio’s return with respect to the benchmark’s return.
The downside capture ratio is used to analyse how a portfolio performed during a bearish trend, i.e. when the benchmark has fallen. A ratio less than 100 indicates that the fund has outperformed the index.
Formula for Down capture ratio
The down capture ratio is calculated by dividing the portfolio’s returns by the returns of the index during the bearish trend and multiplying that factor by 100.
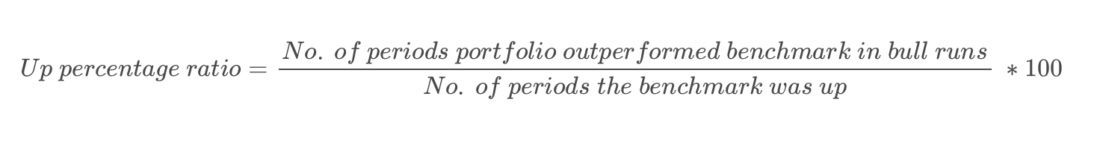
Up percentage ratio
The Up percentage ratio compares the number of periods a portfolio outperformed the benchmark when the benchmark was up. The higher the ratio the better is the performance of the portfolio.
Formula for Up percentage ratio
Stay tuned for the next installment, in which the authors will discuss types of risk metrics.
Visit QuantInsti for additional insight on this topic: https://blog.quantinsti.com/performance-metrics-risk-metrics-optimization/.
Disclosure: Interactive Brokers
Information posted on IBKR Campus that is provided by third-parties does NOT constitute a recommendation that you should contract for the services of that third party. Third-party participants who contribute to IBKR Campus are independent of Interactive Brokers and Interactive Brokers does not make any representations or warranties concerning the services offered, their past or future performance, or the accuracy of the information provided by the third party. Past performance is no guarantee of future results.
This material is from QuantInsti and is being posted with its permission. The views expressed in this material are solely those of the author and/or QuantInsti and Interactive Brokers is not endorsing or recommending any investment or trading discussed in the material. This material is not and should not be construed as an offer to buy or sell any security. It should not be construed as research or investment advice or a recommendation to buy, sell or hold any security or commodity. This material does not and is not intended to take into account the particular financial conditions, investment objectives or requirements of individual customers. Before acting on this material, you should consider whether it is suitable for your particular circumstances and, as necessary, seek professional advice.