


Price action is a trading methodology that has been around for ages and is very popular among the ever-growing trading community. Many retail and institutional traders often make use of the price action trading strategies to estimate and analyze the price movements of financial assets in the short term, this is achieved by analysing historical price behaviour and trends.
Through this article, we will try to deepen our understanding of the price action trading concepts and we will also try to identify price action patterns that develop in real charts.
This article is divided into the following parts:
- What is price action trading?
- Popularity of price action trading
- Different types of charts
- Understanding the market trend
- Concept of support and resistance
- Concept of trendlines
- Identifying support and resistance using Python
- Benefits and drawbacks of price action trading
What is price action trading?
The price action strategy is a trading practice where the utmost importance is given to the study of price movement & behaviour over time rather than depending on various technical indicators to anticipate the upcoming trend and take up relevant long/short positions.
Although most price action traders do not use common trading indicators such as the Moving Averages, Bollinger Bands or the RSI, it is not a mandatory practice and some traders may prefer to include a couple of indicators in their trading setups to increase the accuracy.
However, the weightage given to pure price movements would always be far greater than the weightage assigned for the technical indicators.
The most sought after trading set-ups that price action traders look for are the ones that offer the best possible risk-to-reward ratio.
These setups may include various kinds of emerging breakout patterns (eg: trendlines, flags, triangles, wedges), trend reversal patterns like the head and shoulder pattern, double tops, double bottoms, etc.
Apart from the above, it is also very important to be able to identify key levels such as the support and resistance zones and have a basic understanding of various candlestick pattern analyses.
Popularity of price action trading
The vast majority of market participants strongly believe that forecasting asset prices is next to impossible because there are so many factors that can influence the prices of these assets. Indeed, it is very difficult to develop a perfect system that will work regardless of the ever-changing market cycles & trends.
However, it has been observed that asset price movements in the near term can at times be correctly estimated using a combination of past price data and some basic knowledge of technical analysis. This is precisely where the price action trading strategy comes into the picture.
Price action at its core is very simple and easy to grasp even by budding traders. Another plus point is that it works really well across multiple asset classes such as stocks, commodities and can even be applied in the forex and crypto markets.
But what makes this strategy stand out among the trading community is the fact that it helps traders feel more in control as they are scoping for trading opportunities based on their own interpretations of price action.
At the same time, the strategy also offers a ton of flexibility in aspects like position sizing, risk/reward management, entry and exit points, etc which can’t be easily achieved while one is following a standard rule-based trading system.
Different types of charts
A simple line chart provides a summary of closing price data for an asset over a specified period of time. The following is an example of a simple line chart that displays Apple’s daily closing price data.
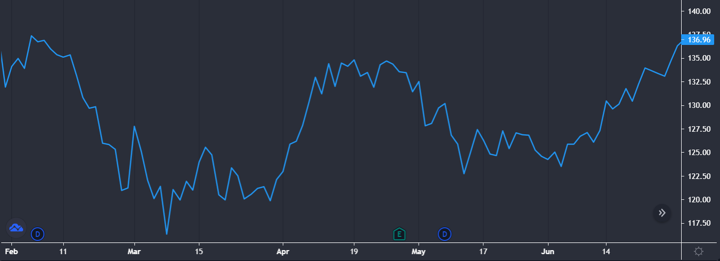
Charting platform: tradingview.com
A drawback of the line chart is that other important data such as the opening price for the day, highest and lowest traded price are simply not included in the chart.
Thus for better technical analysis, candlestick/ bar charts are preferred over line charts as they include and represent this additional data that can be followed to precisely study the price movements during a specified time period.
The following is a Candlesticks chart which also illustrates the Open, High, Low, Close data at every interval.
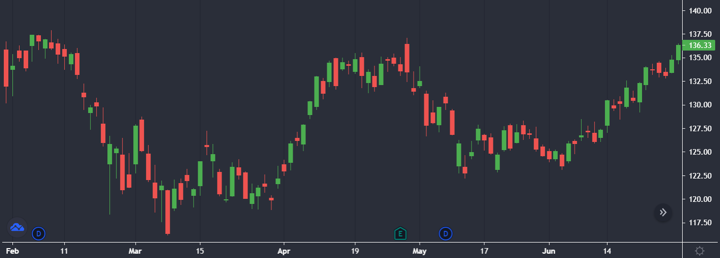
(Source: tradingview.com)
A crisp understanding of how candlesticks are used to represent OHLC data is required to be able to spot and read price action in charts. If you wish to learn more about candlesticks you can visit this link.
Understanding the market trend
Downtrend
Whenever the price moves in a manner where it forms a series of Lower Highs and Lower Lows when compared to its previous swing high and swing low, we can say that there is an ongoing downtrend or Bearish trend in the asset prices.
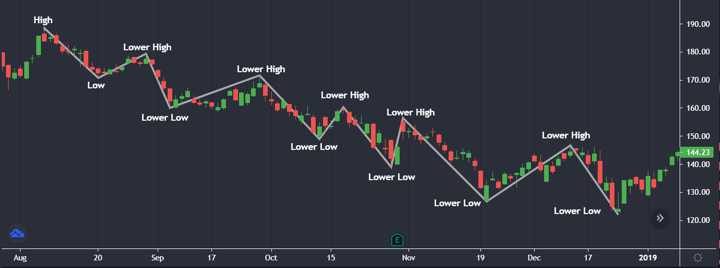
(Source: tradingview.com)
Uptrend
When prices continuously move to form a series of Higher Highs and Higher Lows in comparison to its previous swing high and swing low, we can conclude that the asset prices are in an Uptrend or Bullish trend.
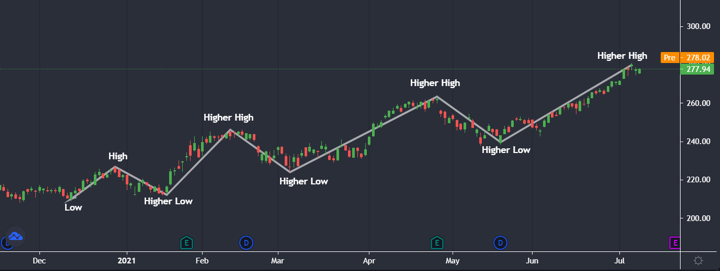
(Source: tradingview.com)
Sideways Trend
If the swing highs and swing lows tend to move within a horizontal range over time, the trend could be termed a Sideways Trend. Prices often move in a sideways direction during a consolidation phase. These phases could later give rise to a continuation of the existing uptrend/downtrend or sometimes may even indicate the possibility of a reversal in the overall trend.
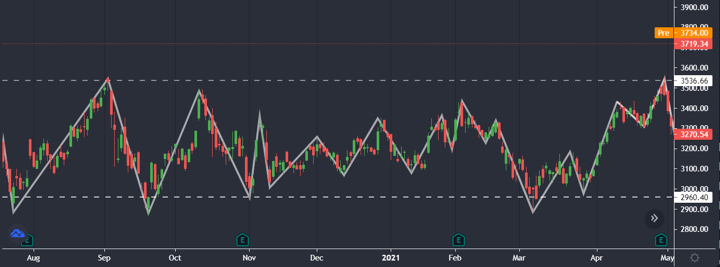
(Source: tradingview.com)
Stay tuned for the next installment of this series, in which Kevin Patrao will explain the concept of support and resistance.
For additional insight on this topic visit QuantInsti blog: https://blog.quantinsti.com/price-action-trading/.
Disclosure: Interactive Brokers
Information posted on IBKR Campus that is provided by third-parties does NOT constitute a recommendation that you should contract for the services of that third party. Third-party participants who contribute to IBKR Campus are independent of Interactive Brokers and Interactive Brokers does not make any representations or warranties concerning the services offered, their past or future performance, or the accuracy of the information provided by the third party. Past performance is no guarantee of future results.
This material is from QuantInsti and is being posted with its permission. The views expressed in this material are solely those of the author and/or QuantInsti and Interactive Brokers is not endorsing or recommending any investment or trading discussed in the material. This material is not and should not be construed as an offer to buy or sell any security. It should not be construed as research or investment advice or a recommendation to buy, sell or hold any security or commodity. This material does not and is not intended to take into account the particular financial conditions, investment objectives or requirements of individual customers. Before acting on this material, you should consider whether it is suitable for your particular circumstances and, as necessary, seek professional advice.
Disclosure: Forex
There is a substantial risk of loss in foreign exchange trading. The settlement date of foreign exchange trades can vary due to time zone differences and bank holidays. When trading across foreign exchange markets, this may necessitate borrowing funds to settle foreign exchange trades. The interest rate on borrowed funds must be considered when computing the cost of trades across multiple markets.
Disclosure: Bitcoin Futures
TRADING IN BITCOIN FUTURES IS ESPECIALLY RISKY AND IS ONLY FOR CLIENTS WITH A HIGH RISK TOLERANCE AND THE FINANCIAL ABILITY TO SUSTAIN LOSSES. More information about the risk of trading Bitcoin products can be found on the IBKR website. If you're new to bitcoin, or futures in general, see Introduction to Bitcoin Futures.
Disclosure: Margin Trading
Trading on margin is only for sophisticated investors with high risk tolerance. You may lose more than your initial investment. For additional information regarding margin loan rates, see ibkr.com/interest
Disclosure: Futures Trading
Futures are not suitable for all investors. The amount you may lose may be greater than your initial investment. Before trading futures, please read the CFTC Risk Disclosure. A copy and additional information are available at ibkr.com.