


Get up-to-speed with RSI Indicator with the tutorial in Part III.
RSI and divergence
RSI indicator can also be used to predict a divergence in the trend before the price trend actually reverses.
Divergence can usually be spotted when, for example, if the price line is moving higher but the RSI indicator slumps due to the fact that the relative strength of the asset weakens when compared to the previous periods’ growth.
For example, let’s say that the price has been closing higher than the previous days but the gain is not as substantial as compared to the average gain of the period. Then, the RSI will close lower than the previous day’s value. In this regard, we can get a signal that the market will get a check on the price in a few days and thus trade accordingly. You can see that in the following graph where the RSI shows a downward trend while the prices keep rising. Eventually, the closing prices decrease too.
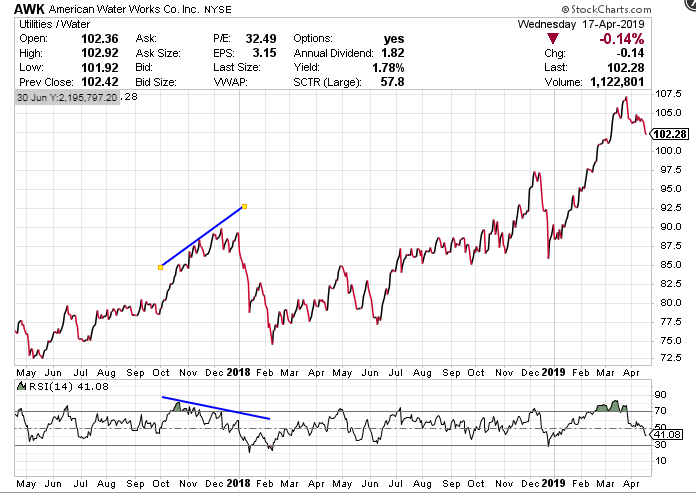
The same is true when the closing price has been bearish for a while but the RSI starts posting higher values, it means that the prices will pick up.
RSI double bottom signal and double top signal
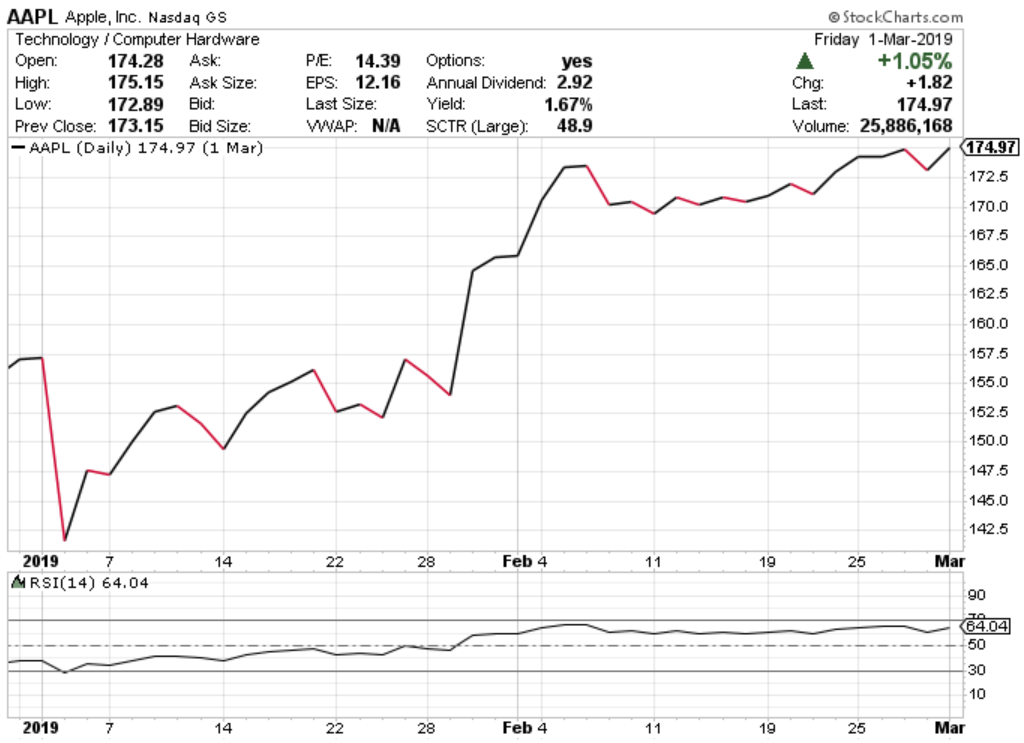
As we have discussed in the section on Bollinger Bands, we can identify the double bottom and double top pattern using the RSI indicator too. The gist of the double bottom pattern identification is as follows.
- The RSI indicator closes below 30 before rising higher and above the 30 barriers.
- It again heads south but closes above 30 before rising again sharply.
This is seen as a “W” formation on the chart. Traders usually use this pattern as a confirmation that the market is headed for the bullish direction. You can see in the following graph that the RSI indicator breached the 30 barriers on 2 Jan before rising up sharply and then closed below, but above the 30 barriers on 7 Jan. It then rose again and continued to rise throughout the month of January and February which indicates a bullish run.
Similar to the double bottom, the pattern formation for the double top is as follows:
- The RSI indicator breaches the 70 levels before dropping again below the 70 levels.
- It again rises but closes below 70 and then drops sharply again.
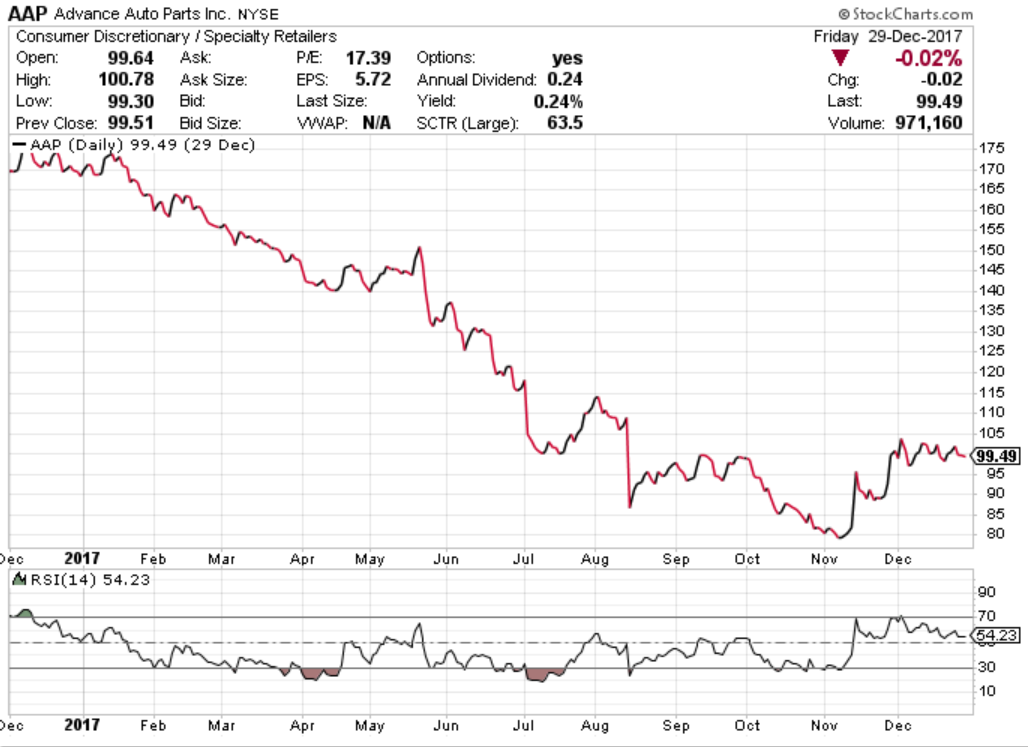
This is seen as an “M” formation on the price chart. Traders usually use this pattern as a confirmation that the market is headed for the bearish direction. You can see in the graph given below, the RSI level breaches 70 on Dec ’17. Later, it falls below the 70 thresholds and while it does rise higher, it does not cross the 70 thresholds again and then starts dropping, indicating a bearish run which lasts a year.
Stay tuned for the next installment in this series to learn more about RSI and MACD strategy.
Visit QuantInsti to download additional code:
https://blog.quantinsti.com/rsi-indicator/
Disclosure: Interactive Brokers
Information posted on IBKR Campus that is provided by third-parties does NOT constitute a recommendation that you should contract for the services of that third party. Third-party participants who contribute to IBKR Campus are independent of Interactive Brokers and Interactive Brokers does not make any representations or warranties concerning the services offered, their past or future performance, or the accuracy of the information provided by the third party. Past performance is no guarantee of future results.
This material is from QuantInsti and is being posted with its permission. The views expressed in this material are solely those of the author and/or QuantInsti and Interactive Brokers is not endorsing or recommending any investment or trading discussed in the material. This material is not and should not be construed as an offer to buy or sell any security. It should not be construed as research or investment advice or a recommendation to buy, sell or hold any security or commodity. This material does not and is not intended to take into account the particular financial conditions, investment objectives or requirements of individual customers. Before acting on this material, you should consider whether it is suitable for your particular circumstances and, as necessary, seek professional advice.