


Measuring the dispersion in a financial dataset is one of the most important tasks in quantitative finance. Whether it is for signal generation in a trading strategy or for risk management, standard deviation is the most popular volatility measure used in the financial markets. In this blog, we unravel this metric and discuss its various use cases working with real financial data in Python.
We’ll cover the following:
- Definition of standard deviation
- What is standard deviation?
- Standard deviation formula
- Examples of standard deviation from real life
- Why use standard deviation?
- Unit of standard deviation
- Standard deviation vs Variance
- Standard deviation for sample data
- Standard deviation for sample data – Bessel’s correction
- Standard deviation in Finance and Trading
- Standard deviation as a measure of volatility
- Computing annualized volatility of stocks using Python
- The z-score
- Value at Risk
- Confidence intervals
Definition of Standard deviation
In statistics,
The standard deviation (σ) is a measure that is used to quantify the amount of variation or dispersion of data from its mean.
In other words, the standard deviation gives us information about the magnitude of the average deviation from the mean of the data. So, if the values in a dataset lie close together, the standard deviation would be small.
On the other hand, if the values are spread out, the standard deviation would be larger.
What is Standard Deviation?
Let’s get back to the very basics.
What is meant by deviation from the mean?
Simply put, the deviation is the distance of a data point from the mean. Consider a random variable X which consists of n different observations x1,x2,…,xn, Below, we show the deviations of two observations x1 and x2 from the mean of X.
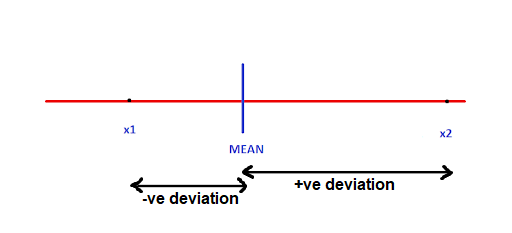
Deviation here tells us how far an observation is from the mean. It can be positive as well as negative, based on whether the observation is greater or lesser than the mean respectively.
What if we measure the total deviation by summing all such values i.e.,

We’ll end up with zero because the positive and negative values will cancel each other out! What if we take the absolute values and sum them instead? We could. Either that or we could square the differences and aggregate them. The latter is preferred because it has attractive mathematical properties.
So, to repeat, we square the differences to get rid of the positive and negative signs and compute their average. This resultant quantity is called the variance, which captures the dispersion in the data.
Standard deviation is a standardized version of the variance, obtained by taking the positive square root of the variance and hence the name, standard deviation. In the next section, we will discuss the formula to calculate the standard deviation.
Standard deviation formula
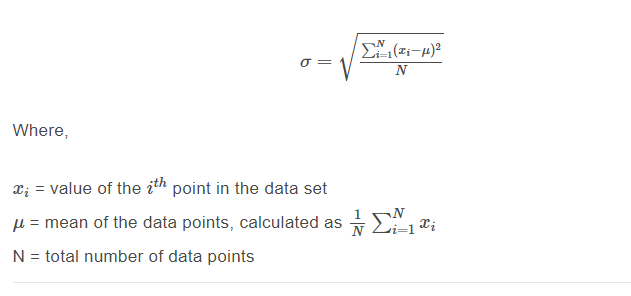
The formula for calculating the standard deviation (denoted by σ) is as follows:
Stay tuned for the next installment, in which the authors will demonstrate examples of standard deviation from real life.
Visit QuantInsti for additional insight on this topic: https://blog.quantinsti.com/standard-deviation/
Disclosure: Interactive Brokers
Information posted on IBKR Campus that is provided by third-parties does NOT constitute a recommendation that you should contract for the services of that third party. Third-party participants who contribute to IBKR Campus are independent of Interactive Brokers and Interactive Brokers does not make any representations or warranties concerning the services offered, their past or future performance, or the accuracy of the information provided by the third party. Past performance is no guarantee of future results.
This material is from QuantInsti and is being posted with its permission. The views expressed in this material are solely those of the author and/or QuantInsti and Interactive Brokers is not endorsing or recommending any investment or trading discussed in the material. This material is not and should not be construed as an offer to buy or sell any security. It should not be construed as research or investment advice or a recommendation to buy, sell or hold any security or commodity. This material does not and is not intended to take into account the particular financial conditions, investment objectives or requirements of individual customers. Before acting on this material, you should consider whether it is suitable for your particular circumstances and, as necessary, seek professional advice.