


The article “Trend-Following Filters – Part 3” first appeared on Alpha Architect Blog.
This is the third article in a series of three, the first two are available here and here. Those articles focus on examining from a digital signal processing (DSP) perspective 1 various types of digital filters that are designed to model trends in time series, in order to illustrate their properties and limitations. This article discusses a different signal processing tool called a “filter bank”.
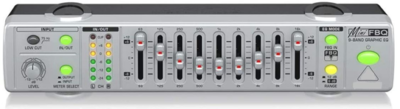
Filter banks are used in many areas of electrical engineering, telecommunications, and other fields in applications such as audio, video, and image noise reduction, compression, storage, and transmission. A familiar example of a filter bank is the audio graphic equalizer, which can be used to alter music sound quality, e.g., to boost bass frequencies, which are generally between 20 and 300 Hertz (cycles per second), relative to treble frequencies, which are generally between 2,000 and 16,000 Hertz.
1. Digital Analysis-Synthesis Filter Bank
Filter banks 2 can be designed to work with either continuous-time analog signals, such as music and speech, or discrete-time digital signals, such as high-definition television and wireless communication. The general form of a digital filter bank that can be used to implement a range of different operations is called an “M-band digital analysis-synthesis filter bank” and is comprised of three parts:
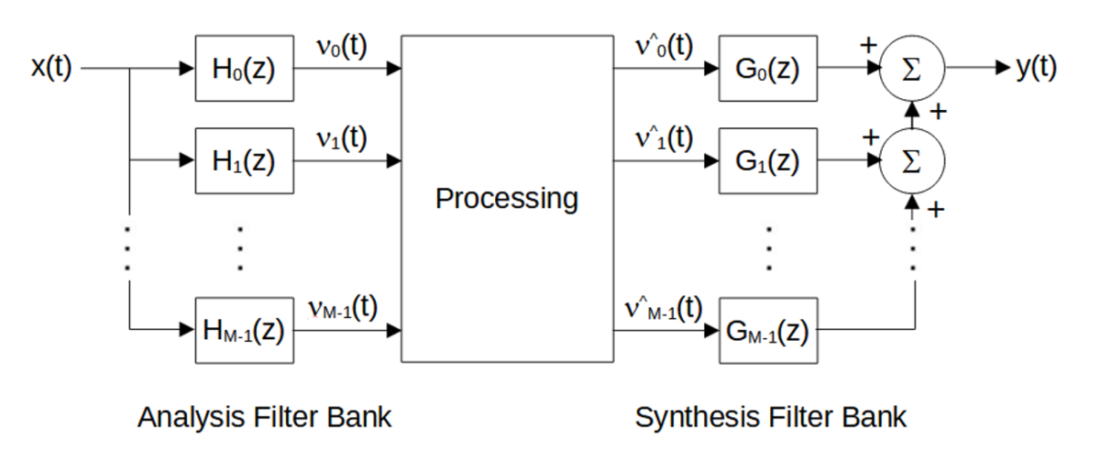
M-Band Digital Analysis-Synthesis Filter Bank
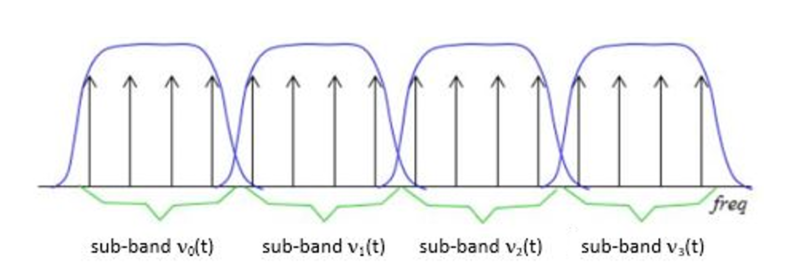
- Analysis filter bank – Splits the input signal x(t) at each integer time step t into an M number of frequency components (M > 1), called “sub-bands”, using a set of digital filters arranged in parallel. Each filter in the analysis filter bank is designed to pass a specific frequency sub-band νi(t), with each sub-band occupying a portion of the original frequency band of x(t). These filters are represented by the Hi(z) blocks in the diagram above.
- Processing – Performs transformations, such as compression, on the individual sub-bands, based on the filter bank design objective. The processed sub-band outputs are represented by ν^i(t).
- Synthesis filter bank – Combines the processed sub-band outputs into a single output signal y(t) using addition. The synthesis operation can include ancillary filtering operations, represented by the Gi(z) blocks.
2. Example Digital Analysis-Synthesis Filter Bank
The following example illustrates the digital analysis-synthesis filter bank concept. The design objective is to produce a “de-noised” output y(t) of the input time series x(t).
The three parts of the example filter bank are as follows:
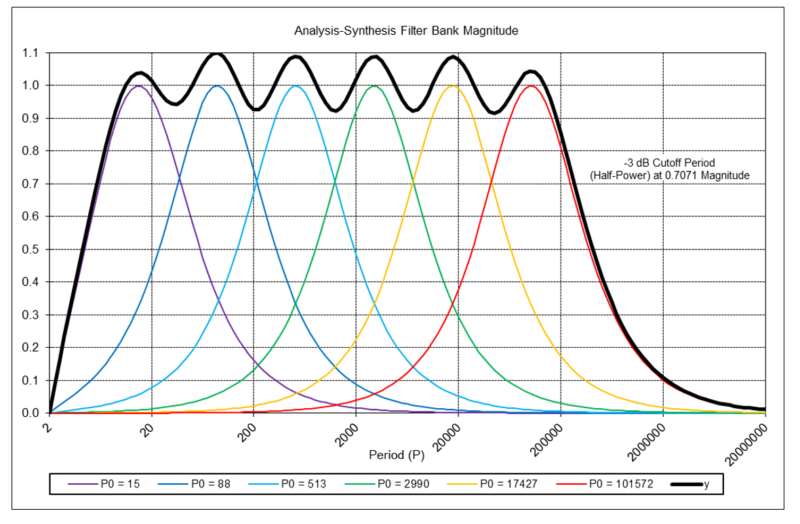
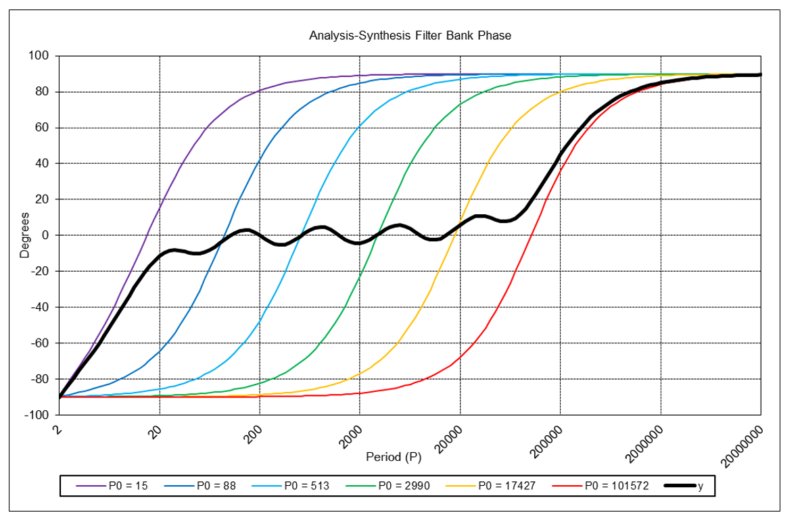
- Analysis filter bank – The analysis filter bank is comprised of a set of six second-order IIR bandpass digital filters (M = 6). The details of the bandpass filter design are described in the Appendix. The center periods P0 of the six filters are set to 15, 88, 513, 2990, 17427, and 101572 time samples, respectively, in order to have nonoverlapping passbands at the -3 dB (half-power) period cutoff points of the filters. This arrangement effectively attenuates short periods below around 6 time samples, which are considered to be “noise” with respect to daily data (i.e., an input x(t) sampling interval of once per trading day at the market close) for the purposes of the example, while passing the longer periods. The quality factor Q of each filter is set to 0.5, i.e., critically damped (see the Appendix), in order to balance filter output responsiveness versus lag.
- Processing – No additional processing is performed. The analysis filter bank outputs νi(t) are passed directly to the synthesis filter bank inputs ν^i(t).
- Synthesis filter bank – The Gi(z) filters adjust the gain of each ν^i(t) using multiplication so that the average maximum passband magnitude of the output y(t) is approximately 1.0 (0 dB):
Gi(z) = 0.886
The graphs below show the magnitude and phase spectrums of the individual analysis filter bank outputs νi(t) and the synthesis filter bank output y(t). Note that the horizontal x-axis of both graphs uses a base-10 logarithmic scale, which is nonlinear.
Visit Alpha Architect Blog to read the rest of the article.
Notes:
- For background information on DSP, read my post An Introduction to Digital Signal Processing for Trend Following ↩
- A detailed discussion of digital filter banks can be found in: Diniz, P. S. R., da Silva, E. A., B., and Netto, S. L., Digital Signal Processing – System Analysis and Design, Cambridge University Press, 2010. ↩
Disclosure: Alpha Architect
The views and opinions expressed herein are those of the author and do not necessarily reflect the views of Alpha Architect, its affiliates or its employees. Our full disclosures are available here. Definitions of common statistics used in our analysis are available here (towards the bottom).
This site provides NO information on our value ETFs or our momentum ETFs. Please refer to this site.
Disclosure: Interactive Brokers
Information posted on IBKR Campus that is provided by third-parties does NOT constitute a recommendation that you should contract for the services of that third party. Third-party participants who contribute to IBKR Campus are independent of Interactive Brokers and Interactive Brokers does not make any representations or warranties concerning the services offered, their past or future performance, or the accuracy of the information provided by the third party. Past performance is no guarantee of future results.
This material is from Alpha Architect and is being posted with its permission. The views expressed in this material are solely those of the author and/or Alpha Architect and Interactive Brokers is not endorsing or recommending any investment or trading discussed in the material. This material is not and should not be construed as an offer to buy or sell any security. It should not be construed as research or investment advice or a recommendation to buy, sell or hold any security or commodity. This material does not and is not intended to take into account the particular financial conditions, investment objectives or requirements of individual customers. Before acting on this material, you should consider whether it is suitable for your particular circumstances and, as necessary, seek professional advice.