


The post “Value Investing: An Examination of the 1,000 Largest Firms” first appeared on Alpha Architect Blog.
Among stock investors, a common strategy/belief held is Value investing — buying stocks that are relative cheaper on price/fundamental ratios.
The idea behind why value investing works is that Value stocks are either (1) riskier and/or (2) have been mispriced by the market. In theory, these elements of risk/mispricing lead to expected above-market returns.
However, this strategy has failed over the past couple of years, causing many to doubt/question what is going on with the strategy. Given the recent underperformance, there have been a lot of articles written about the “Death of Value Investing.”
Some of these articles that examine this question, “Is Value Dead?”, have examined the performance of two well-known indices, the Russell 1000 Value index, and the Russell 1000 Growth index. These are widely referenced in the industry, are market-cap-weighted, and have returns going back to 1979.
Since Value is supposed to beat Growth over the long-run, how have the indices performed?
Below is the performance from 1/1/1979 through 7/31/2020 of the Russell 1000 index, the Russell 1000 Growth index, and the Russell 1000 Value index. 1
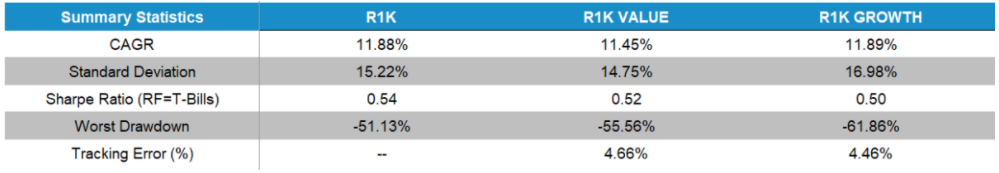
The results are hypothetical results and are NOT an indicator of future results and do NOT represent returns that any investor actually attained. Indexes are unmanaged, do not reflect management or trading fees, and one cannot invest directly in an index.
What immediately jumps out is that Value has lost to Growth over the entire time sample!
As a Value investor, a disappointment to say the least.
Digging deeper, let’s look at the performance over the past 10 years (8/1/2010-7/31/2020):
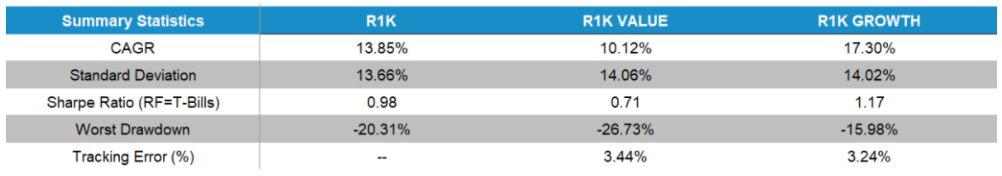
The results are hypothetical results and are NOT an indicator of future results and do NOT represent returns that any investor actually attained. Indexes are unmanaged, do not reflect management or trading fees, and one cannot invest directly in an index.
Viewed another way, since the human mind has issues with compounding:
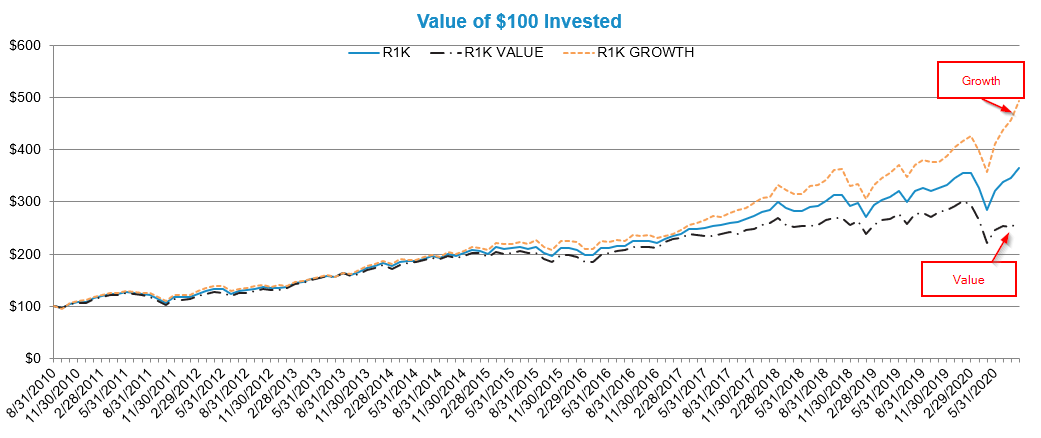
The results are hypothetical results and are NOT an indicator of future results and do NOT represent returns that any investor actually attained. Indexes are unmanaged, do not reflect management or trading fees, and one cannot invest directly in an index.
And last, for the real pain, over the past 1, 3, and 5 years (through 7/31/2020):
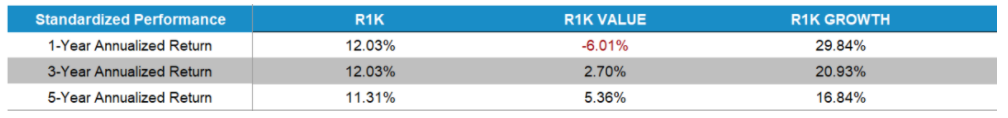
The results are hypothetical results and are NOT an indicator of future results and do NOT represent returns that any investor actually attained. Indexes are unmanaged, do not reflect management or trading fees, and one cannot invest directly in an index.
Thus, in some people’s minds, Value investing is dead.
However, let’s take a step back for a moment.
What is Value investing?
It is simply trying to buy stocks that are cheaper when compared to other stocks.
But what does it mean for a stock to be cheap?
Let us look at a simple example. Pretend that there are only 4 stocks in the universe in which we can invest. We are going to simply look at the firms’ earnings each year, and compare that to the price one would pay if you bought the entire company’s equity (i.e. the firm’s market capitalization). This is the simple P/E ratio.
4 Stock Example:
- Stock 1: Earnings = $100, Market Cap = $1000, Price/Earnings = 10
- Stock 2: Earnings = $50, Market Cap = $1000, Price/Earnings = 20
- Stock 3: Earnings = $25, Market Cap = $1000, Price/Earnings = 40
- Stock 4: Earnings = $10, Market Cap = $1000, Price/Earnings = 100
So in my simple 4-stock example, Stocks 1 and 2 trade at a lower multiple of earnings relative to Stocks 3 and 4. A systematic Value investor, who only uses the P/E multiple, would prefer Stocks 1 and 2 compared to Stocks 3 and 4.
As a shopping example, Stocks 1 and 2 are “on-sale” compared to stocks 3 and 4. All 4 firms have the same market cap, but firms 1 and 2 make more $ (earnings) each year. So they “value” or “cheap” stocks.
Of course, my example above is very simplified and we are only looking at one point-in-time number–past year’s earnings.
Firms 3 and 4 may be growing at a faster rate, and we can create more advanced models to try to figure out the “best” investment. However, if it were the case that experts can create better models, then active managers wouldn’t lose to the market ~ 80% of the time over 5 years.
Academics have studied how Value stocks perform relative to Growth stocks. In general, they use the book value of assets divided by the market cap of the firm, as this was the measure used in the seminal 1992/1993 Fama and French papers.
What did they find?
They found that Value stocks outperformed Growth stocks. In the original paper, they highlight that this is most likely compensation for taking on additional risk (to underscore that this is not a free lunch). 2
Of course, one can use other measures to identify cheap stocks, besides P/E and B/M. We examined different methods here. However, the big picture takeaway was the following — Value beat Growth.
So back to our Russell 1000 examples–why then, does the Russell 1000 indices have Growth beating Value?
Part of this is the construction process that they use. Here are the three variables that they use.
- Book-to-Market
- Medium-term forecast earnings growth rate based on I/B/E/S two-year forecasts
- Sales-per-share growth rate based on five-year historical sales
Without making any judgments on whether or not this is a good/bad process, one should note that the methodology is definitely different than the simple example above, which was simply splitting firms on the P/E multiple (or other value measures, like B/M or EBIT/TEV).
Visit Alpha Architect Blog to read the full post.
Disclosure: Alpha Architect
The views and opinions expressed herein are those of the author and do not necessarily reflect the views of Alpha Architect, its affiliates or its employees. Our full disclosures are available here. Definitions of common statistics used in our analysis are available here (towards the bottom).
This site provides NO information on our value ETFs or our momentum ETFs. Please refer to this site.
Disclosure: Interactive Brokers
Information posted on IBKR Campus that is provided by third-parties does NOT constitute a recommendation that you should contract for the services of that third party. Third-party participants who contribute to IBKR Campus are independent of Interactive Brokers and Interactive Brokers does not make any representations or warranties concerning the services offered, their past or future performance, or the accuracy of the information provided by the third party. Past performance is no guarantee of future results.
This material is from Alpha Architect and is being posted with its permission. The views expressed in this material are solely those of the author and/or Alpha Architect and Interactive Brokers is not endorsing or recommending any investment or trading discussed in the material. This material is not and should not be construed as an offer to buy or sell any security. It should not be construed as research or investment advice or a recommendation to buy, sell or hold any security or commodity. This material does not and is not intended to take into account the particular financial conditions, investment objectives or requirements of individual customers. Before acting on this material, you should consider whether it is suitable for your particular circumstances and, as necessary, seek professional advice.