


In 2023, the potential for performance dispersion among equities (i.e., some stocks doing quite well and some quite poorly) could mean it finally pays for growth and tech equity investors to consider getting selective again. Amidst a challenging economic outlook, from rates to potential recession, there are themes that may be poised to shine within growth and within technology. This means getting more precise about where to find opportunities that can navigate challenging near-term economic conditions, while seeking to capture exposure to long-term structural Megatrends.
KEY TAKEAWAYS
- Dispersion returns: We believe dispersion across growth equities could return to historically higher levels, which means investors may want to be more selective to identify potential winners from losers than in years past.
- Fiscal policy could provide ballast: Trillions of new dollars in fiscal spending — ranging from the U.S. Inflation Reduction Act (IRA) to the U.S. Infrastructure Investment and Jobs Act (IIJA) to the European Union’s Global Gateway — should provide meaningful support specifically for clean energy, electric vehicles (EVs) and infrastructure in 2023 and beyond.
- Healthcare innovation continues: While investors have punished medical innovation of late, relative inelastic demand for medicine coupled with potential breakthroughs in genomics, immunology and neurology, may mean the space is being underestimated given recent challenged performance.
- Tech staples could separate from the pack: Tech is not a monolith. We believe cybersecurity and robotics have the potential to buck the economic cycle given cybersecurity has moved from niche to necessity and robots are mission-critical in fighting supply chain challenges, labor shortages and inflation.
DISPERSION RETURNS
2023 could well be the year to upend almost three years of growth and tech stocks moving in virtual unison.
The pandemic pulled forward demand for innovation. This, in combination with extremely loose financial conditions, led to broad blockbuster equity performance. The Russell 2000 Growth and the Nasdaq-100 Indexes surged a whopping 95% and 105%, respectively, from March 2020 to October 2021.1 In fact, over half of Nasdaq 100 firms were up over 90% in the period.2
In 2022, the script was flipped. Investors faced geopolitical conflict, supply chain disruption, monetary policy reversal and surging inflation, leading to a broad retreat. The Russell 2000 Growth and the Nasdaq-100 have declined 29% and 32%, respectively, through September 30, 2022.3 And half of Nasdaq-100 firms were down more than 30% during this period.4
These two periods look quite different on the surface, but they were both characterized by high correlation across growth and technology stocks, meaning these equities largely traded up or down together. We see this phenomenon as attributable to the fact that the drivers above — pandemic-induced tech adoption, unprecedented monetary policy loosening and then equally unprecedented tightening — were unilaterally moving markets.
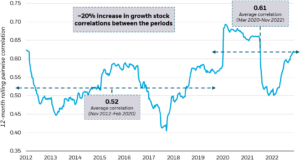
Almost three years of heightened correlation between growth stocks
Pairwise correlation between stocks in the Nasdaq-100 Index
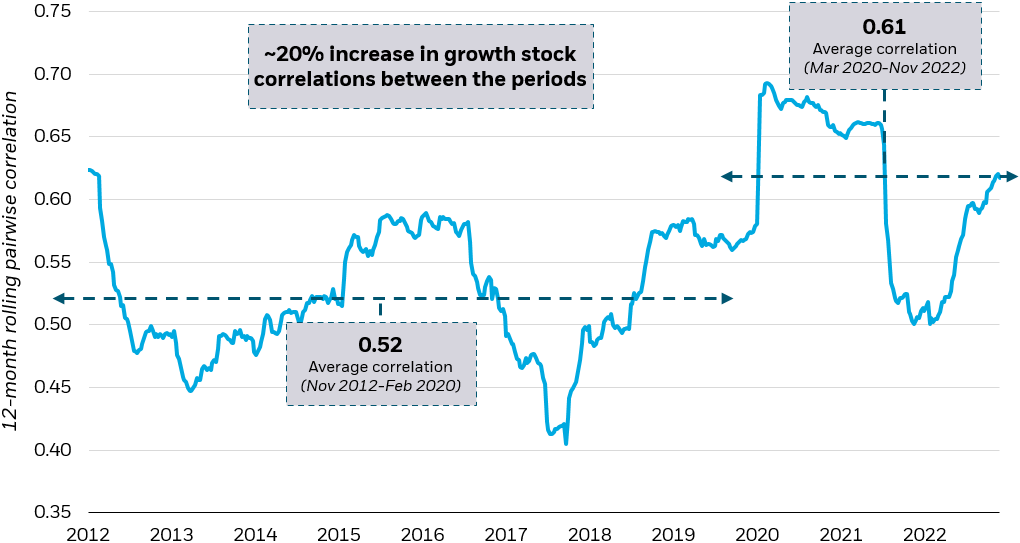
Source: BlackRock, Reuters. Daily average pairwise correlation on a 12-month rolling basis of the Nasdaq-100 Index from 11/6/2012 to 11/1/2022. Pairwise correlation is a statistic that measures the degree to which two securities move in relation to one another. The pairwise correlation between stocks is a value between -1 and 1. Two stocks that perform identically will have a value of 1, while two stocks that are perfectly inversely related will have a value of -1.
Index performance is for illustrative purposes only. Index performance does not reflect any management fees, transaction costs or expenses. Indexes are unmanaged and one cannot invest directly in an index. Past performance does not guarantee future results.
Chart description: Line chart showing the daily average pairwise correlation on a 12-month rolling basis of the Nasdaq-100 Index from 11/6/2012 to 11/1/2022. The chart shows that the average correlation from November 2012 to March 2020 was 0.52, and it increased about 20% to 0.61 from March 2020-November 2022.
While uncertainty abounds as we look to 2023, three things are clear to us.
- We do not believe heightened growth stock correlations are likely to persist. We anticipate a reversion back to historical norms given that recent developments, from the end of central banks’ “easy money” policies to the beginning of a multiyear deglobalization trend, may contribute to greater economic uncertainty and market volatility.
- Because of 2022’s headwinds, relative valuations may appear more attractive than in recent years. Although still elevated from historical averages, the Russell 2000 Growth and Nasdaq-100 price-to-earnings (P/E) ratios, which measure the relationship between a company’s stock price and earnings per share (EPS), were at 10.4x and 21.6x on September 30, 2022, near their lowest points since March 2020.5 In other words, growth and technology stocks may currently be undervalued relative to recent valuations.
- We believe economic weakness and persistent inflation are likely to continue to impact the economy unevenly, presenting unique challenges and opportunities.
Because of these three factors, we believe investors may not be well-served by simply “buying growth” or “buying tech.” While more attractive valuations may compel investors to revisit growth stocks in 2023, investors may want to structure their portfolio allocations with greater precision.
We focus our 2023 thematic outlook on three areas that appear primed to both potentially weather the difficult economic and monetary policy environment in the near-term and that could benefit from powerful structural forces over the long term, specifically: beneficiaries of fiscal spending, areas of healthcare innovation, and counter-cyclical segments of the technology sector.
GOVERNMENT SPENDING PROVIDES A STEADY BUYER AND COULD HELP ACCELERATE GROWTH
Themes in focus: infrastructure, clean energy, electric vehicles
Over $1.5 trillion of U.S. government spending will be directed towards infrastructure, clean energy and electric vehicles in 2023 and beyond. An additional €300 billion from the European Union’s Global Gateway will also support these themes.6 As projects come online, the magnitude of fiscal spending should help accelerate these themes and uncover great synergies.INFRASTRUCTURECLEAN ENERGY AND ELECTRIC VEHICLES
INFRASTRUCTURE
The Infrastructure Investment and Jobs Act (IIJA) directs $1.2 trillion to U.S. infrastructure.7 $110 billion across 4,300 projects has been announced for 2023. Across the country, from California to Illinois to New York, $21.6 billion in announced spending8 includes purchasing battery-electric buses in Los Angeles,9 modernizing air traffic control in Peoria10 and improving rail connection through the East River Tunnel into Manhattan.11
Map of infrastructure projects funded by federal grants
IIJA funding is impacting communities across the United States

Source: Agency Press Releases, Build.gov Publicly Announced IIJA Funding (Formula and Discretionary) as of September 6, 2022.
Graphic description: Map of the United States illustrating the scope of the IIJA. Data points represent announced funding for projects (formula and discretionary) as of September 6, 2022. All data represented on this map, including project locations, is preliminary and non-binding.
Nationwide, infrastructure enablers — from construction to materials — could be the first to benefit from this spending boom. Meanwhile, elevated inflation and interest rates could help infrastructure owners, notably power, water and sanitation, appear attractive given inflation-linked revenues, long-term fixed debt and the provision of services, such as lights, water and trash collection, that are typically less sensitive to recession.
CLEAN ENERGY AND ELECTRIC VEHICLES
The Inflation Reduction Act (IRA), which became law in August, built on the IIJA’s strong foundation — directing $370 billion to clean energy and EVs — dollars that will flow for a decade.12 While $370 billion is the Congressional Budget Office’s (CBO) projection, tax credits may be utilized far more, and spending may well double to as much as $800 billion.13 This is where synergies could come into play. The IIJA and the IRA work in tandem and reinforce one another, creating a virtuous cycle for clean energy and EVs.
A virtuous cycle
More consumer demand for EVs could drive more use of government incentives for suppliers that lower EV costs, resulting in yet more demand.
Virtuous cycle of EV supply and demand drivers
EV supply and demand drivers, including IIJA and IRA incentives, reinforce and create synergies
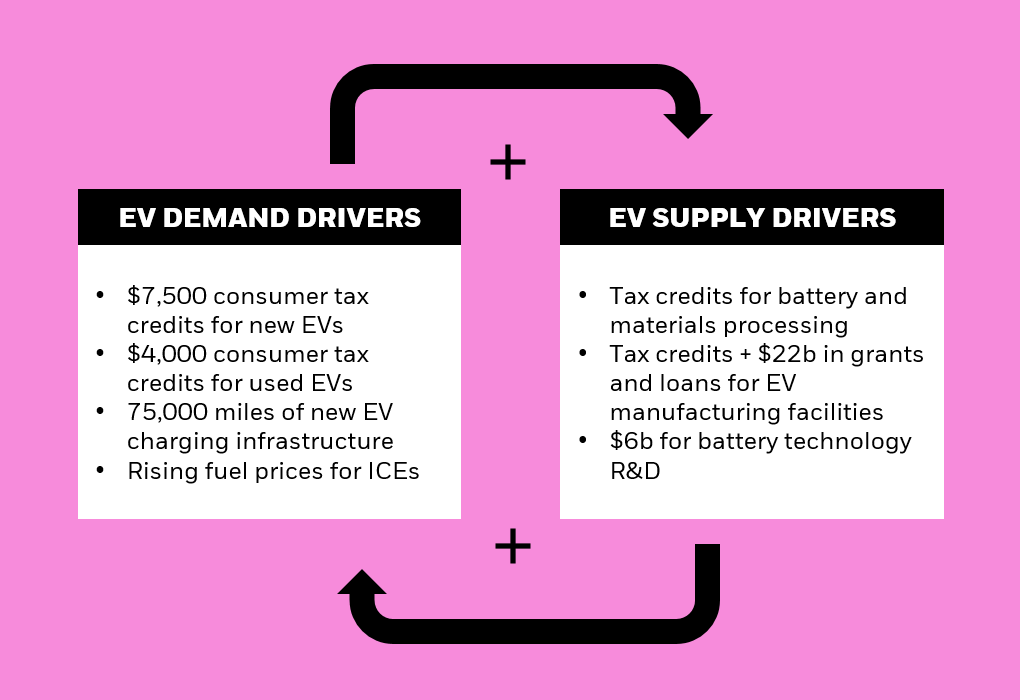
Source: Senate Democrats, “Summary of the Energy Security and Climate Change Investments in the Inflation Reduction Act of 2022,” accessed on November 4, 2022. U.S. Department of Transportation, “Historic Step: All Fifty States Plus D.C. and Puerto Rico Greenlit to Move EV Charging Networks Forward, Covering 75,000 Miles of Highway,” as of September 27, 2022. U.S. Senator Ben Cardin, “Bipartisan Infrastructure Investment and Jobs Act Summary,” as of September 2022.
Graphic description: Illustration depicting the virtuous cycle between the EV demand and supply drivers. The arrows indicate that the bulleted lists of EV demand drivers and EV supply drivers impact one another, and the plus symbols indicates where the impact could be positive. Taken together, this could be a positive reinforcing loop — a virtuous cycle.
With the IIJA and the IRA, one plus one equals a lot more than two. For example, the IIJA includes $7.5 billion for 500,000 EV chargers;14 $1.5 billion is already fully available to states and expected to extend EV charging infrastructure across 75,000 miles of highways.15 At the same time, the IRA’s expanded $7,500 tax credit for the purchase of new EVs and a new $4,000 credit for used EVs went into immediate effect.16 These help bring upfront EV purchase costs closer towards price parity with internal combustion engine (ICE) counterparts alongside already lower lifetime ownership costs. The “spending” in the IRA on tax credits, loans and grants depend on voluntary uptake of firms in financing new facilities and production. As a result, we believe that with the potential for increased consumer demand, driven by better charging and lower costs for EVs, will increase manufacturer uptake of these programs significantly. This is likely to supercharge both the IRA’s total spend and impact — that could benefit the entire electric vehicle value chain in the short and mid-term.
We believe government spending could directly benefit infrastructure, clean energy and electric vehicles — which we have long seen as Megatrend themes that may be poised for long-term structural growth. In our view, investors looking to gain exposure to these themes may want to consider targeted ETFs that employ a tailored construction process to capture each theme’s respective value chain.
Click here to read full article
—
Originally Posted November 14, 2022 – 2023 Thematic outlook: Rethink growth
© 2022 BlackRock, Inc. All rights reserved.
1 BlackRock, Bloomberg. Total returns of the Russell 2000 Growth Index and the Nasdaq-100 Index are for the holding period assuming that dividends were reinvested at the spot price. Monthly data from 3/31/2020 to 10/29/2021. Past performance does not guarantee future results.
2 BlackRock, Bloomberg. 52 of the 102 companies in the Nasdaq 100-Index had a total return of more than 90% from 3/31/2020 to 10/29/2021. Total returns are for the holding period assuming that dividends are were reinvested at the spot price. Past performance does not guarantee future results.
3 BlackRock, Bloomberg. Total returns of the Russell 2000 Growth Index and the Nasdaq-100 Index are for the holding period assuming that dividends were reinvested at the spot price. Monthly data from 12/31/2021-9/30/2022. Past performance does not guarantee future results.
4 BlackRock, Bloomberg. 51 of the 102 companies in the Nasdaq 100-Index had a total return less than -30% from 12/31/2021-9/30/2022. Total returns are for the holding period assuming that dividends are were reinvested at the spot price. Past performance does not guarantee future results.
5 BlackRock, Morningstar. Price-to-earnings ratios for the Russell 2000 Growth Index and the Nasdaq-100 Index as of 9/30/22. Past performance does not guarantee future results.
6 European Commission, “Global Gateway,” December 1, 2021
7 U.S. Congress, November 2021.
8 General Services Administration, Data to Decisions, “Bipartisan Infrastructure Law (BIL) Maps Dashboard,” as of October 25, 2022.
9 U.S. Department of Transportation, Federal Transit Administration, “FY22 FTA Bus and Low- and No-Emission Grant Awards,” as of October 24, 2022.
10 U.S. Department of Transportation, Federal Aviation Administration, “Bipartisan Infrastructure Law – Airport Terminals Program,” accessed on November 3, 2022.
11 U.S. Department of Transportation, “Biden Administration, USDOT Announce Over $233 Million in Grants to Upgrade Intercity Passenger Rail Service,” as of August 18, 2022.
12 US Senate, “Summary of the Energy Security and Climate Change Investments in the Inflation Reduction Act of 2022,” July 2022.
13 Credit Suisse Research, September 2022.
14 U.S. Department of Transportation, “President Biden, Department of Transportation Releases Toolkit to Help Rural Communities Build Out Electric Vehicle Charging Infrastructure,” February 2, 2022.
15 U.S. Department of Transportation, “Historic Step: All Fifty States Plus D.C. and Puerto Rico Greenlit to Move EV Charging Networks Forward, Covering 75,000 Miles of Highway,” as of September 27, 2022.
16 US Senate, “Summary of the Energy Security and Climate Change Investments in the Inflation Reduction Act of 2022,” July 2022.
17 U.S. Centers for Medicare & Medicaid Services, National Health Expenditure Accounts Database, accessed Oct 10, 2022.
18 FactSet, accessed October 18, 2022.
19 Prime Therapeutics, “Gene/Cell Therapy Quarterly Update: September 2022,” Sep 30, 2022.
20 Moderna, “Moderna announces first participants dosed in phase 3 study of seasonal influenza vaccine candidate (mrna-1010),” June 7, 2022.
21 BioSpace, “With 34 Vaccine Programs in Development, Moderna Eyes Global Launches,” Sep 9, 2022.
22 Fierce Pharma, “Bristol’s Breyanzi wins broader FDA nod, bringing CAR-T showdown with Gilead to earlier lymphoma,” Jun 24, 2022.
23 Research & Markets, “Global $6+ Billion CAR-T Therapy Market Opportunities and Strategies to 2030,” Jan 29, 2021.
24 Research & Markets, “Global CAR-T Cell Therapy Markets, Competition, Forecast and Opportunities, 2027 – Rapidly Growing Clinical Trial Activities, Proliferative M&A Activities, and Lucrative IPOs,” April 4, 2022.
25 Grand View Research, “Antibody-Drug Conjugates Market Size, Share & Trends Analysis Report Application (Blood Cancer, Breast Cancer, Urothelial/Bladder Cancer), By Technology (Cleavable, Non-cleavable), By Payload Technology, And Segment Forecasts, 2022 – 2030,” Apr 2022.
26 IQVIA, “The Global Use of Medicines 2022,” Jan 2022.
27 IQVIA, “Global Trends in R&D,” Feb 2022.
28 Biogen, “Lecanemab Confirmatory Phase 3 Clarity Ad Study Met Primary Endpoint, Showing Highly Statistically Significant Reduction of Clinical Decline In Large Global Clinical Study Of 1,795 Participants With Early Alzheimer’s Disease,” Sep 2022.
29 FBI, “Internet Crime Report 2021”, 2022
30 Cybersecurity Ventures, Nov 2020
31 Jones Day Insights, March 2022
32 European Commission, March 2022
33 Markets and Markets, “Biometric System Market by Authentication Type (Single Factor, Fingerprint, Iris, Face, Voice; Multi-factor), Type (Contact-based, Contactless, Hybrid), Offering Type, Mobility, Vertical & Region (2022-2027),” March 2022.
34 BlackRock, FactSet, as of 10/31/2022. The S&P 500 tech sector is represented by the S&P 500 Information Technology Sector Index. Cybersecurity is represented by the NYSE FactSet Global Cyber Security Index. Past performance does not guarantee future results.
35 Bureau of Labor Statistics, August 2022
36 Atlanta Fed Wage Growth Tracker
37 NY Fed, Global Supply Chain Pressure Index
38 WSJ – U.S. Companies on Pace to Bring Home Record Number of Overseas Jobs, 8/23/22
39 BlackRock, FactSet, trailing twelve-month price-to-earnings ratio as of 10/31/22. Past performance does not guarantee future results.
40 Facts and Factors, RaaS Market by Service Type, 3/14/22
41 Intel.com, Autonomous Mobile Robots and Autonomous Viral Killing Robots
42 Market Research Future, “Global Robotics Market Research Report,” August 2021.
Carefully consider the Funds’ investment objectives, risk factors, and charges and expenses before investing. This and other information can be found in the Funds’ prospectuses or, if available, the summary prospectuses, which may be obtained by visiting the iShares Fund and BlackRock Fund prospectus pages. Read the prospectus carefully before investing.
Investing involves risk, including possible loss of principal.
International investing involves risks, including risks related to foreign currency, limited liquidity, less government regulation and the possibility of substantial volatility due to adverse political, economic or other developments. These risks often are heightened for investments in emerging/ developing markets or in concentrations of single countries.
Funds that concentrate investments in specific industries, sectors, markets or asset classes may underperform or be more volatile than other industries, sectors, markets or asset classes and than the general securities market.
Technologies perceived to displace older technologies or create new markets may not in fact do so. Companies that initially develop a novel technology may not be able to capitalize on the technology.
Companies in the healthcare sector may be affected by government regulations and programs, changes in the cost of medical products and services, changes in the demand for medical products and services among other factors. Healthcare companies are subject to competitive forces that may result in product obsolescence.
Actively managed funds do not seek to replicate the performance of a specified index. Actively managed funds may have higher portfolio turnover than index funds.
This material represents an assessment of the market environment as of the date indicated; is subject to change; and is not intended to be a forecast of future events or a guarantee of future results. This information should not be relied upon by the reader as research or investment advice regarding the funds or any issuer or security in particular.
The strategies discussed are strictly for illustrative and educational purposes and are not a recommendation, offer or solicitation to buy or sell any securities or to adopt any investment strategy. There is no guarantee that any strategies discussed will be effective.
The information presented does not take into consideration commissions, tax implications, or other transactions costs, which may significantly affect the economic consequences of a given strategy or investment decision.
This material contains general information only and does not take into account an individual’s financial circumstances. This information should not be relied upon as a primary basis for an investment decision. Rather, an assessment should be made as to whether the information is appropriate in individual circumstances and consideration should be given to talking to a financial professional before making an investment decision.
The information provided is not intended to be tax advice. Investors should be urged to consult their tax professionals or financial professionals for more information regarding their specific tax situations.
The Funds are distributed by BlackRock Investments, LLC (together with its affiliates, “BlackRock”).
The iShares Funds are not sponsored, endorsed, issued, sold or promoted by Bloomberg, BlackRock Index Services, LLC, Cohen & Steers, European Public Real Estate Association (“EPRA®”), FTSE International Limited (“FTSE”), ICE Data Indices, LLC, NSE Indices Ltd, JPMorgan, JPX Group, London Stock Exchange Group (“LSEG”), MSCI Inc., Markit Indices Limited, Morningstar, Inc., Nasdaq, Inc., National Association of Real Estate Investment Trusts (“NAREIT”), Nikkei, Inc., Russell or S&P Dow Jones Indices LLC or STOXX Ltd. None of these companies make any representation regarding the advisability of investing in the Funds. With the exception of BlackRock Index Services, LLC, which is an affiliate, BlackRock Investments, LLC is not affiliated with the companies listed above.
Neither FTSE, LSEG, nor NAREIT makes any warranty regarding the FTSE Nareit Equity REITS Index, FTSE Nareit All Residential Capped Index or FTSE Nareit All Mortgage Capped Index. Neither FTSE, EPRA, LSEG, nor NAREIT makes any warranty regarding the FTSE EPRA Nareit Developed ex-U.S. Index or FTSE EPRA Nareit Global REITs Index. “FTSE®” is a trademark of London Stock Exchange Group companies and is used by FTSE under license.
© 2022 BlackRock, Inc. All rights reserved. BLACKROCK, BLACKROCK SOLUTIONS, BUILD ON BLACKROCK, ALADDIN, iSHARES, iBONDS, FACTORSELECT, iTHINKING, iSHARES CONNECT, FUND FRENZY, LIFEPATH, SO WHAT DO I DO WITH MY MONEY, INVESTING FOR A NEW WORLD, BUILT FOR THESE TIMES, the iShares Core Graphic, CoRI and the CoRI logo are trademarks of BlackRock, Inc., or its subsidiaries in the United States and elsewhere. All other marks are the property of their respective owners.
iCRMH1122U/S-2597505
Disclosure: iShares by BlackRock
The iShares Funds are distributed by BlackRock Investments, LLC (together with its affiliates, “BlackRock”).
The iShares Funds are not sponsored, endorsed, issued, sold or promoted by Markit Indices Limited, nor does this company make any representation regarding the advisability of investing in the Funds. BlackRock is not affiliated with Markit Indices Limited.
©2022 BlackRock, Inc. All rights reserved. iSHARES and BLACKROCK are registered trademarks of BlackRock, Inc., or its subsidiaries in the United States and elsewhere. All other marks are the property of their respective owners.
Disclosure: Interactive Brokers
Information posted on IBKR Campus that is provided by third-parties does NOT constitute a recommendation that you should contract for the services of that third party. Third-party participants who contribute to IBKR Campus are independent of Interactive Brokers and Interactive Brokers does not make any representations or warranties concerning the services offered, their past or future performance, or the accuracy of the information provided by the third party. Past performance is no guarantee of future results.
This material is from iShares by BlackRock and is being posted with its permission. The views expressed in this material are solely those of the author and/or iShares by BlackRock and Interactive Brokers is not endorsing or recommending any investment or trading discussed in the material. This material is not and should not be construed as an offer to buy or sell any security. It should not be construed as research or investment advice or a recommendation to buy, sell or hold any security or commodity. This material does not and is not intended to take into account the particular financial conditions, investment objectives or requirements of individual customers. Before acting on this material, you should consider whether it is suitable for your particular circumstances and, as necessary, seek professional advice.
Disclosure: ETFs
Any discussion or mention of an ETF is not to be construed as recommendation, promotion or solicitation. All investors should review and consider associated investment risks, charges and expenses of the investment company or fund prior to investing. Before acting on this material, you should consider whether it is suitable for your particular circumstances and, as necessary, seek professional advice.

