


")


In the past month, U.S. natural gas prices (Henry Hub Futures) have declined 51%, marking the worst 30-day performance we have on record.1 They are now 26% below the levels seen on the eve of the Ukrainian war (February 19, 2022). U.S. natural gas prices are not necessarily a representation of global prices, and the Ukrainian war shock affected European natural gas prices more (European prices more than tripled at one point in 2022). But even European natural gas prices are now 28% below the levels seen on the eve of the invasion.2
To be clear, there is no typo in the date of this publication (January 28, 2023) and the Ukrainian war is still ongoing. So why have natural gas prices fallen so much? The answer lies largely in the weather. Both the U.S. and Europe have had unseasonably warm winters. Although there have been some sharp dips in temperature in some regions, they have been short-lived. Natural gas is largely used for heating purposes and also for power production (electricity).
Europe Averts Crisis, with a Little Help from Policy and Good Weather
Europe has made a conscious effort to fill its natural gas storage capacity going into winter and reduce its demand for energy, with a European Union (EU) agreed target to reduce gas demand by 15% from August 2022 to March 2023. Bruegel3 estimate that in 2022, natural gas demand in Europe was 12% lower than the 2019–2021 average. Demand was 27% lower in October 2022, 24% lower in November, and 13% lower in December for the selection of EU countries with available data (versus the averages for 2019–2021). According to Gas Infrastructure Europe,4 natural gas storage in Europe was 80% filled in Europe on January 13, 2023, compared to 47% on the same day in 2022 and 63% in 2021.
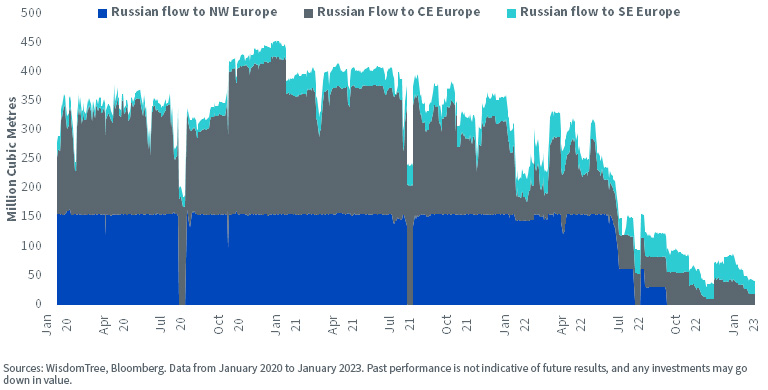
As a result, Europe doesn’t need as much U.S. natural gas imports to replace Russian supplies as many had feared in 2022. That is true even though Russian supplies to North West Europe have fallen to zero and are negligible elsewhere in the EU.
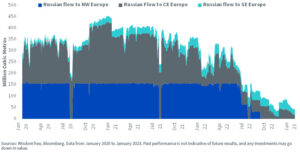
Russian Natural Gas Flows to Europe (Daily)
U.S. LNG Export Capacity Hamstrung, but for How Long?
Added to the U.S.’s woes is that its largest liquified natural gas (LNG) terminal—responsible at its peak for close to 20% of the U.S.’s natural gas exports—has been offline since June 2022. Freeport LNG shut after a fire and its reopening has been constantly delayed. Because Freeport is not exporting gas, natural gas inventory is building up in the U.S., keeping supply there flush.
Freeport’s latest guidance (sent in December 2022) is for a reopening this month (January). Given constant delays, it’s unsurprising the market doesn’t believe this announcement as we head into the final stretch of the month. However, there are reports that there was a surge in gas flow to the terminal over the Martin Luther King, Jr., holiday weekend (January 14–16).5 That indicates it is readying to start operations. Although as far as we are aware Freeport has not yet received US Federal Energy Regulation Commission approval to start production.
U.S. Gas Looks Cheap to Europeans
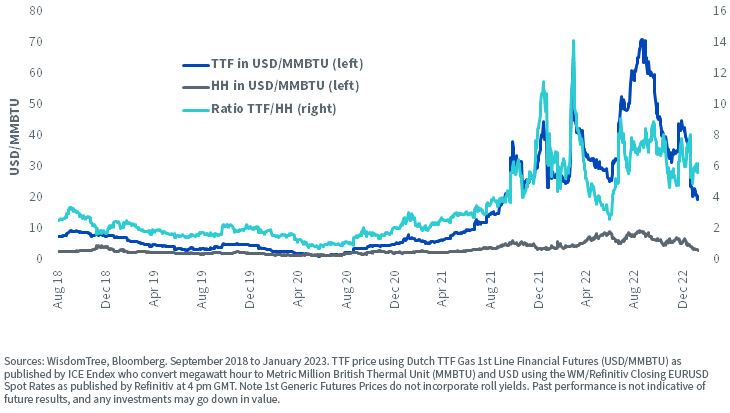
EU natural gas prices currently trade at six times U.S. prices (and in 2022, it was sometimes more than eight times). Although liquifying and regasing adds cost, U.S. natural gas prices are still attractive to import. While storage facilities are 80% filled in Europe, the scarring stress of worrying about insufficient supplies in 2022 should motivate the EU to opportunistically fill storage to 100% whenever possible. The EU was lucky that weather was on its side this winter. The same cannot be guaranteed for future seasons.
U.S. and European Gas Price Compared in USD/MMBTU
Europe Is Building More Storage Capacity and Will Be Able to Import More U.S. Gas
The EU is frantically building new storage capacity as well. LNG import capacity in the EU and the U.K. will expand by 34%, or 6.8 billion cubic feet per day, by 2024 compared with 2021.6 Based on the Gas Infrastructure Europe database,7 we see that a large number of these projects should complete in 2023 and that the EU intends to continue to build capacity beyond 2024. So, while storage may be 80% filled today, capacity will continue to widen, giving U.S. exports further room to grow.
Cold Spell May Be Favorable for U.S. Demand
The National Oceanic and Atmospheric Administration (NOAA) is predicting temperatures to be below normal between February 3rd to February 9th8 across most of the U.S. We know weather can change abruptly and forecasts are hard to rely on (we were caught out on this in December 2022, when NOAA predicted a cold month, but temperatures surprised to the upside overall). However, if NOAA are correct, we could see higher domestic natural gas consumption.
Is Bearishness Overdone?
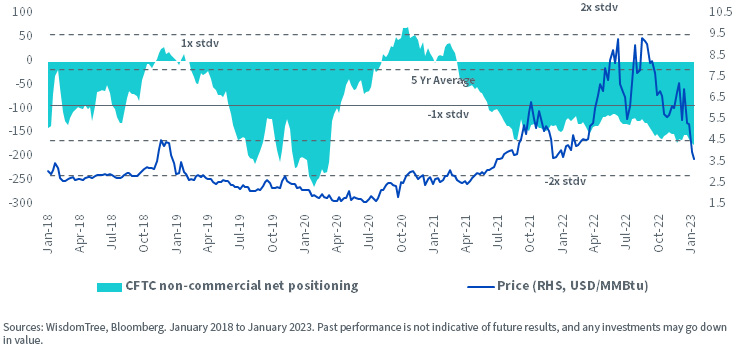
Positioning in natural gas futures is net short 176,0009 (more than 1 standard deviation below the five-year average), marking a bearish signal. That is the most negative since March 2020, which was the peak of COVID-19 market stress in the energy markets.
Natural Gas Net Futures Positioning
Conclusions
Warmer-than-normal temperatures have reduced natural gas demand in the U.S. and Europe. In Europe, thrifting has reduced demand for U.S. gas imports. But have prices fallen too much in response? The Ukrainian war is certainly not over, and gas supplied from Russia has slowed to a trickle. As Europe builds more capacity, it will need more U.S. gas, and the U.S. should be able to export it as Freeport reopens. With shorts so stretched, we could see a potent reversal in U.S. natural gas prices.
1 Source: Bloomberg. We have front month Henry Hub Futures, data to 4/2/1990. As of 1/13/23.
2 Source: Bloomberg. Using Front Month. As of 1/13/23.
3 Bruegel, 1/13/23.
4 Gas Infrastructure Europe, 1/13/23.
5 Reuters, 1/17/23.
6 Energy Information Administration, November 2022.
7 Gas Infrastructure Europe database, 1/18/23.
8 National Oceanic and Atmospheric Administration, 1/26/23.
9 CTFC, 1/10/23.
—
Originally Posted January 30, 2023 – Have We Hit Peak-Bearishness on Natural Gas Yet?
Important Disclosure Related to this Article: Nitesh Shah is an employee of WisdomTree UK Limited, a European subsidiary of WisdomTree Asset Management Inc.’s parent company, WisdomTree Investments, Inc.
Disclosure: WisdomTree U.S.
Investors should carefully consider the investment objectives, risks, charges and expenses of the Funds before investing. U.S. investors only: To obtain a prospectus containing this and other important information, please call 866.909.WISE (9473) or click here to view or download a prospectus online. Read the prospectus carefully before you invest. There are risks involved with investing, including the possible loss of principal. Past performance does not guarantee future results.
You cannot invest directly in an index.
Foreign investing involves currency, political and economic risk. Funds focusing on a single country, sector and/or funds that emphasize investments in smaller companies may experience greater price volatility. Investments in emerging markets, real estate, currency, fixed income and alternative investments include additional risks. Due to the investment strategy of certain Funds, they may make higher capital gain distributions than other ETFs. Please see prospectus for discussion of risks.
WisdomTree Funds are distributed by Foreside Fund Services, LLC, in the U.S. only.
Interactive Advisors offers two portfolios powered by WisdomTree: the WisdomTree Aggressive and WisdomTree Moderately Aggressive with Alts portfolios.
Disclosure: Interactive Brokers
Information posted on IBKR Campus that is provided by third-parties does NOT constitute a recommendation that you should contract for the services of that third party. Third-party participants who contribute to IBKR Campus are independent of Interactive Brokers and Interactive Brokers does not make any representations or warranties concerning the services offered, their past or future performance, or the accuracy of the information provided by the third party. Past performance is no guarantee of future results.
This material is from WisdomTree U.S. and is being posted with its permission. The views expressed in this material are solely those of the author and/or WisdomTree U.S. and Interactive Brokers is not endorsing or recommending any investment or trading discussed in the material. This material is not and should not be construed as an offer to buy or sell any security. It should not be construed as research or investment advice or a recommendation to buy, sell or hold any security or commodity. This material does not and is not intended to take into account the particular financial conditions, investment objectives or requirements of individual customers. Before acting on this material, you should consider whether it is suitable for your particular circumstances and, as necessary, seek professional advice.
Disclosure: Futures Trading
Futures are not suitable for all investors. The amount you may lose may be greater than your initial investment. Before trading futures, please read the CFTC Risk Disclosure. A copy and additional information are available at ibkr.com.


