


![[Gamma] Scalping Please](https://ibkrcampus.com/wp-content/smush-webp/2024/04/tir-featured-8-700x394.jpg.webp "[Gamma] Scalping Please")


Just when the MBS Agency market seemed destined for a winning month, Halloween arrived and wiped out those good efforts and another losing month was posted.
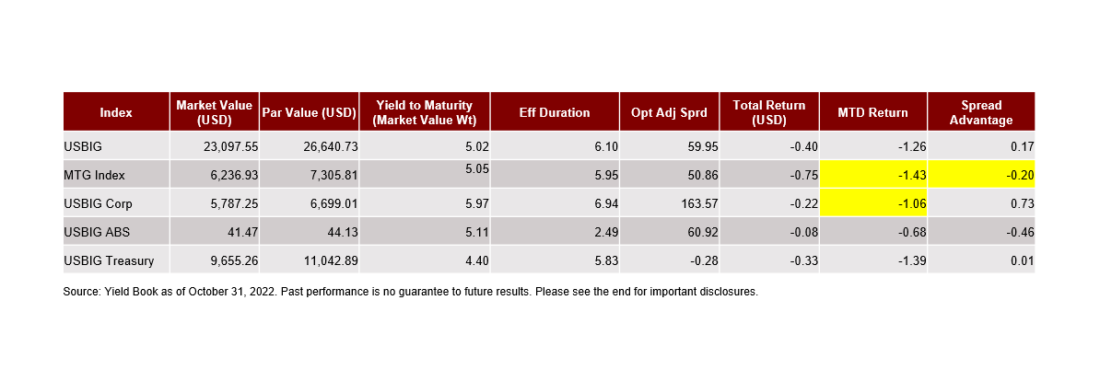
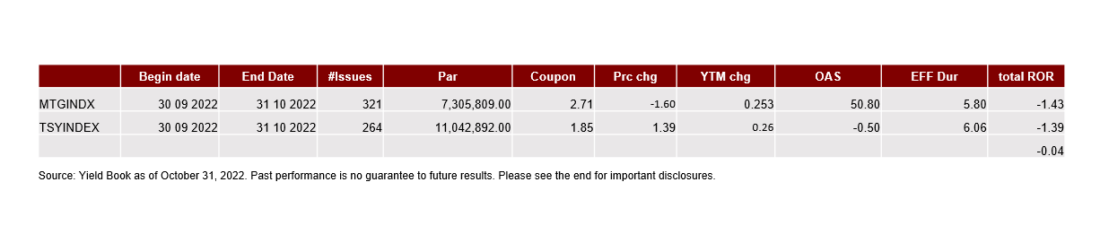
A whiff of supply (just $2B), a hint of the Fed (FOMC meeting this week), and fast money took their chips off the table and booked the last of October’s profits. MBS had excelled into late October as historically widening spreads were too good to resist while rates rallies had seemed to settle things. However, the oncoming specter of another rates hike spooked the market and index players failed to show. Spread advantage was -20bps and MTD returns were -4bps (both against riskless Treasuries). 10yr Treasury rates crested to 4.24%, before a late month rally took them 30bps lower, and the 2s/10s curve with it (-47bps net).
Nine (9) of the eleven (11) TBA coupons trade at a discount to par, with only 30yr 6.5%s “quoted” above $103, and 6%s alternately between $100 and $101 on occasion. Markets are being loosely quoted on 7%s, with one FNMA 7% pool being issued. That was for $216,000, not even eligible for the $250, 000 minimum balance required to be TBA eligible/good delivery (WAC was 7.5%, 97% LTV, 1 loan).
On the supply side, Originator selling has sunk dramatically, barely reaching $1.5B on some days ($2.14B per day avg), volleying between 4.5%s, 5%s, 5.5%s, 6%s and 6.5% coupons. Refi activity has fallen to just 28% of overall mortgage applications and prepay speeds have dropped to 6CPR on FNMAs and FHLMCs and 9CPR along GNMAs. Extension risk remains at the top of every bondholder’s list.
Dollar Rolls have been sedate, trading well below carry, with only 6%s and 6.5%s offering any market pop, and GNMA II upper coupons outpacing conventionals. As TBA interest wanes, Spec Pool BWICs heated up a bit, CMO accumulators focusing on 4.5% through 5.5%s for current return aspirations. In fact, most recent CMO deals centered around 5.5% collateral.
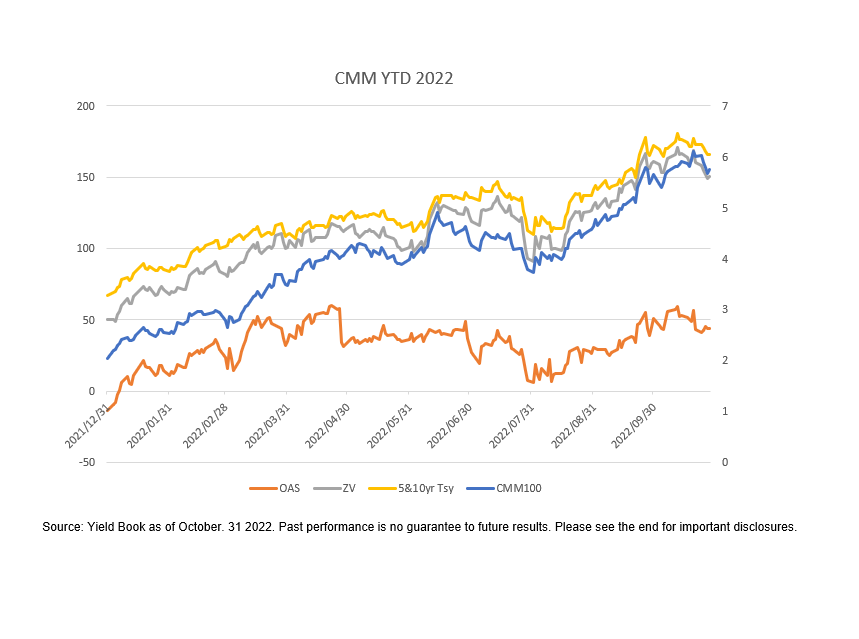
MONTH TO DATE; results were steady and fractionally tighter on spread as the backdrop settled in after the first week or two. The 30yr current coupon (par based) rose 23 bps to 5.87%, while comparative spreads were mixed as OAS spreads barely moved at 50.955, ZV spreads firmed -4.9bps to 155.675, and measures against the 5&10yr treasury blend were also flat at 171.623.
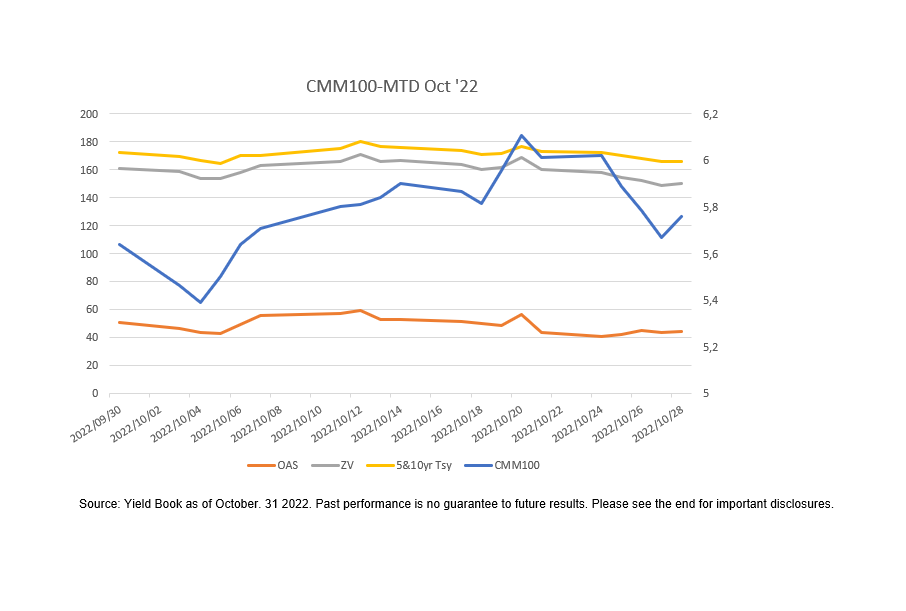
YEAR TO DATE results are more dramatic since 2022 commenced; 30yr CC +383bps, OAS +64.57bps, ZV +105.85bps and vs the 5&10yr treasury blend +104.54bps.
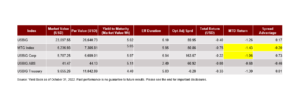
As most investors make the move “up in coupon” (UIC), we thought you’d like to know what that looks like. We employed TBA constituents 30yr FNMA 4.5%s, 30yr FNMA 5.5%s and FNMA 6.0%s in a Yield Book Scenario Analysis shocking the curve. In this case, and with the FOMC November and December meetings looming next, we felt it more apropos to move in +/- 75bp clips in line to popular thinking (for at least one rate hike, anyway).
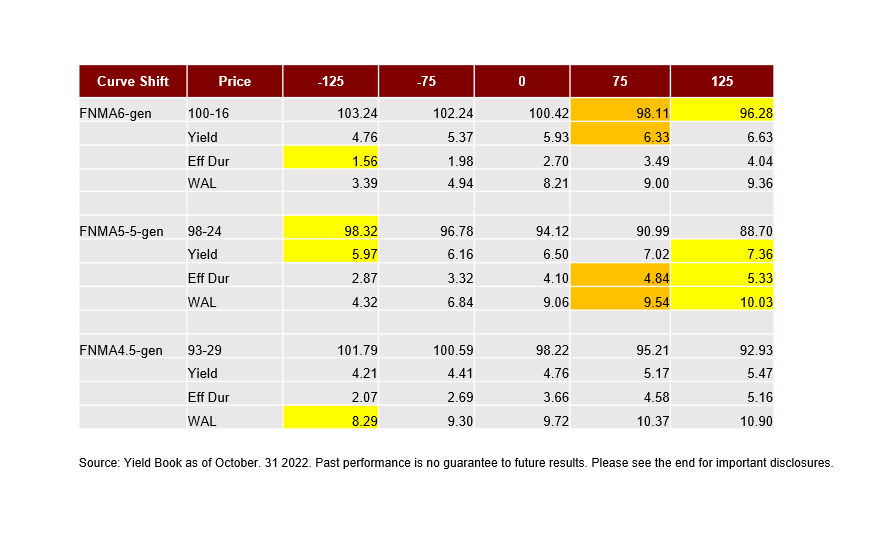
In the immediate case of the FOMC meeting this week, higher 30yr 5.5%s and 6%s perform better into an assumed 75bps hike, with prices one to two points improved from 4.5%s. Extension risk is muted as well, 0.74 years Eff Dur (5.5%s), and WAL increase 0.48 vs 065 to the lower coupon.
Into a rates rally, and somewhat counterintuitively, lower 4.5s do not dominate as only WALs are less dented while 5.5%s and 6%s hold in on price, yield and effective duration.
Always keep in mind, if you were to swap one versus the other, that fuller 5.5%s and 6%s offer a carry advantage of 1/32nds to 1 7/8ths 32nds above 4.5%s with prepay speeds this muted.
For more information on mortgage-backed securities (MBS), subscribe to our blog.
—
Originally Posted November 2, 2022 – US MBS Agency Performance October 2022: MBS Finishes Weakly after Earlier Impressive Rebound
Disclosure: FTSE Russell
Interactive Advisors, a division of Interactive Brokers Group, offers FTSE Russell Index Tracker portfolios on its online investing marketplace. Learn more about the Diversified Portfolios.
This material is not intended as investment advice. Interactive Advisors or portfolio managers on its marketplace may hold long or short positions in the companies mentioned through stocks, options or other securities.
© 2023 London Stock Exchange Group plc and its applicable group undertakings (the “LSE Group”). The LSE Group includes (1) FTSE International Limited (“FTSE”), (2) Frank Russell Company (“Russell”), (3) FTSE Global Debt Capital Markets Inc. and FTSE Global Debt Capital Markets Limited (together, “FTSE Canada”), (4) MTSNext Limited (“MTSNext”), (5) Mergent, Inc. (“Mergent”), (6) FTSE Fixed Income LLC (“FTSE FI”), (7) The Yield Book Inc (“YB”) and (8) Beyond Ratings S.A.S. (“BR”). All rights reserved.
FTSE Russell® is a trading name of FTSE, Russell, FTSE Canada, MTSNext, Mergent, FTSE FI, YB and BR. “FTSE®”, “Russell®”, “FTSE Russell®”, “MTS®”, “FTSE4Good®”, “ICB®”, “Mergent®”, “The Yield Book®”, “Beyond Ratings®“ and all other trademarks and service marks used herein (whether registered or unregistered) are trademarks and/or service marks owned or licensed by the applicable member of the LSE Group or their respective licensors and are owned, or used under licence, by FTSE, Russell, MTSNext, FTSE Canada, Mergent, FTSE FI, YB or BR. FTSE International Limited is authorised and regulated by the Financial Conduct Authority as a benchmark administrator.
All information is provided for information purposes only. All information and data contained in this publication is obtained by the LSE Group, from sources believed by it to be accurate and reliable. Because of the possibility of human and mechanical error as well as other factors, however, such information and data is provided “as is” without warranty of any kind. No member of the LSE Group nor their respective directors, officers, employees, partners or licensors make any claim, prediction, warranty or representation whatsoever, expressly or impliedly, either as to the accuracy, timeliness, completeness, merchantability of any information or of results to be obtained from the use of the FTSE Russell products, including but not limited to indexes, data and analytics or the fitness or suitability of the FTSE Russell products for any particular purpose to which they might be put. Any representation of historical data accessible through FTSE Russell products is provided for information purposes only and is not a reliable indicator of future performance.
No responsibility or liability can be accepted by any member of the LSE Group nor their respective directors, officers, employees, partners or licensors for (a) any loss or damage in whole or in part caused by, resulting from, or relating to any error (negligent or otherwise) or other circumstance involved in procuring, collecting, compiling, interpreting, analysing, editing, transcribing, transmitting, communicating or delivering any such information or data or from use of this document or links to this document or (b) any direct, indirect, special, consequential or incidental damages whatsoever, even if any member of the LSE Group is advised in advance of the possibility of such damages, resulting from the use of, or inability to use, such information.
No member of the LSE Group nor their respective directors, officers, employees, partners or licensors provide investment advice and nothing contained herein or accessible through FTSE Russell products, including statistical data and industry reports, should be taken as constituting financial or investment advice or a financial promotion.
Past performance is no guarantee of future results. Charts and graphs are provided for illustrative purposes only. Index returns shown may not represent the results of the actual trading of investable assets. Certain returns shown may reflect back-tested performance. All performance presented prior to the index inception date is back-tested performance. Back-tested performance is not actual performance, but is hypothetical. The back-test calculations are based on the same methodology that was in effect when the index was officially launched. However, back- tested data may reflect the application of the index methodology with the benefit of hindsight, and the historic calculations of an index may change from month to month based on revisions to the underlying economic data used in the calculation of the index.
This document may contain forward-looking assessments. These are based upon a number of assumptions concerning future conditions that ultimately may prove to be inaccurate. Such forward-looking assessments are subject to risks and uncertainties and may be affected by various factors that may cause actual results to differ materially. No member of the LSE Group nor their licensors assume any duty to and do not undertake to update forward-looking assessments.
No part of this information may be reproduced, stored in a retrieval system or transmitted in any form or by any means, electronic, mechanical, photocopying, recording or otherwise, without prior written permission of the applicable member of the LSE Group. Use and distribution of the LSE Group data requires a licence from FTSE, Russell, FTSE Canada, MTSNext, Mergent, FTSE FI, YB, BR and/or their respective licensors.
Disclosure: Interactive Brokers
Information posted on IBKR Campus that is provided by third-parties does NOT constitute a recommendation that you should contract for the services of that third party. Third-party participants who contribute to IBKR Campus are independent of Interactive Brokers and Interactive Brokers does not make any representations or warranties concerning the services offered, their past or future performance, or the accuracy of the information provided by the third party. Past performance is no guarantee of future results.
This material is from FTSE Russell and is being posted with its permission. The views expressed in this material are solely those of the author and/or FTSE Russell and Interactive Brokers is not endorsing or recommending any investment or trading discussed in the material. This material is not and should not be construed as an offer to buy or sell any security. It should not be construed as research or investment advice or a recommendation to buy, sell or hold any security or commodity. This material does not and is not intended to take into account the particular financial conditions, investment objectives or requirements of individual customers. Before acting on this material, you should consider whether it is suitable for your particular circumstances and, as necessary, seek professional advice.
