By Adila McHich and Gregor Spilker
AT A GLANCE
- Weather, structural changes and geopolitics have combined to push natural gas prices to record highs.
- The U.S. has become the world’s swing supplier, but has faced its own challenges with increased exports and damage from Hurricane Ida.
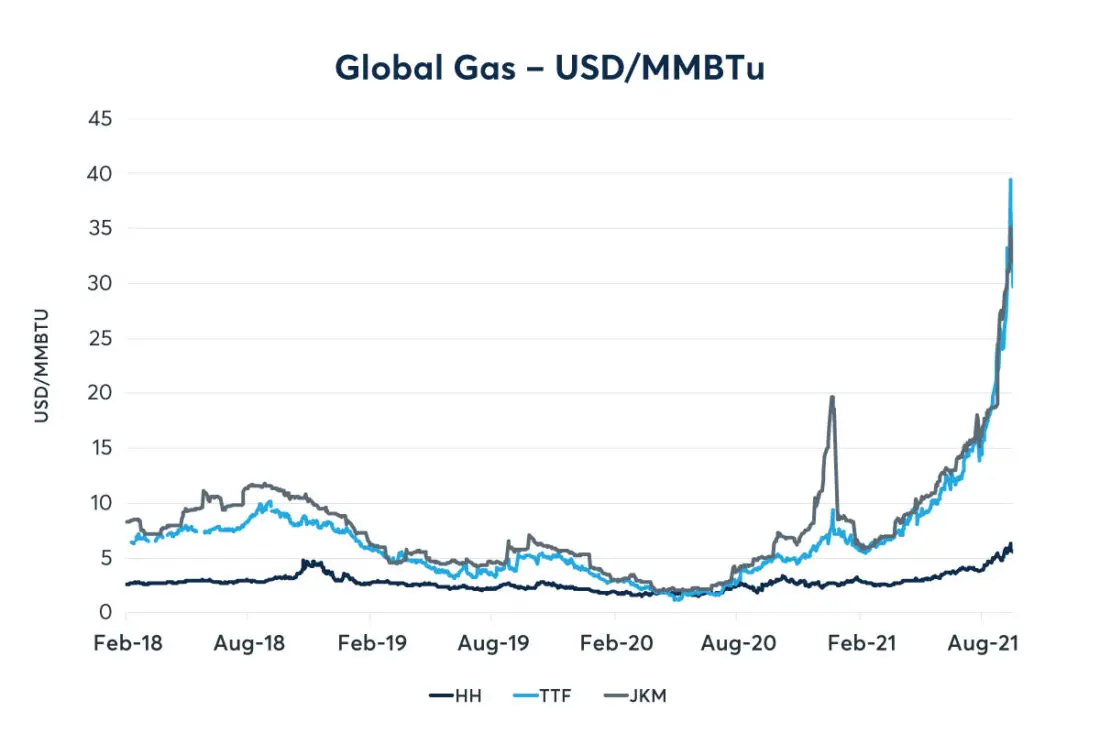
Natural gas prices have risen to seasonal record highs as global gas demand is expanding and supply is not able to keep up. Bullish fundamentals combined with weather-related events have acted as tailwinds to propel prices. The extreme supply tightness of the global gas market is now spilling into oil markets.

Source: CME Group data
When Inelastic Demand Meets Acute Supply Shock
In Europe, natural gas prices have surged to record-high price levels. The front-month contract for the Dutch Title Transfer Facility (TTF), the benchmark price for the European market, has risen fivefold since the beginning of 2021 – from 20 EUR/MWh to more than 100 EUR/MWh (>30 $/MMBTu) in early October. Market observers attribute this unprecedented price rise to a confluence of factors.
Following a colder-than-average 2020-21 winter, gas storage facilities in Europe have not been able to replenish their stocks to sufficient levels ahead of the start of the new winter season. As of October 10, storage levels in Europe were at 77% capacity. The same time last year, they stood at 96%, and 97% the year prior. LNG imports to Europe have not helped enough since Asian demand for liquefied gas continues to pull many cargoes eastwards.
Gazprom, which remains the single largest supplier to the European market, has met contractual delivery obligations but has not been able to deliver additional volume to its customers. Compounding the issue, weak wind output and low hydro storage levels due to drought conditions during the summer means that demand for natural gas for power generation is unusually strong. Industrial demand for natural gas is responding to these unprecedented prices, with some fertilizer plants idling production in recent weeks.
Less Flexibility in Supply
While these factors may be transitory in nature, structural changes in the European natural gas landscape have aggravated the challenging situation. Domestic production is in long-term decline, making European markets more vulnerable to issues in other regions, most notably North Asia. Europe’s largest gas field, Groeningen in the Netherlands, will completely halt production in the coming years. The Rough storage facility in the UK is closing. Overall, that means less flexibility for natural gas supply.
At the same time, demand for natural gas for power generation is only increasing. High carbon emission prices mean that coal plants have become uneconomical, and nuclear energy is out of fashion. That leaves the European market dependent on intermittent renewables and natural gas. As always with fossil fuels, there are geopolitical considerations. It was not lost on market observers that the price of TTF, which reached an intraday high of 160 EUR/MWh on Oct. 6, sold off after Vladimir Putin, the Russian president, said that Russia would be willing to help stabilize gas markets. Russia is also seeking approval of Nordstream 2, the controversial pipeline that will link Russia to Germany directly, bypassing transit countries such as Poland and the Ukraine.
U.S. As the World LNG Swing Supplier
U.S. natural gas prices are also rallying but well below international levels. Henry Hub natural gas prices more than doubled since the beginning of the year and now trade at above $5/MMBTu. The October futures contract month expired at $5.841 – an increase of 178% compared to the same period last year.
The price upswing is attributed to the resiliency of gas demand from the LNG export and industrial sectors while supply is constrained. According to S&P Global Platts Analytics data, feedgas nominations to U.S. Gulf Coast liquefaction facilities currently operate at near full capacity and averaged 10.3 Bcf/d for the week ending Oct. 5. The export growth has been driven by Asian demand – predominantly China, Japan, South Korea and India. These countries have imported about 38.4% of U.S.-sourced LNG since February 2016, while Europe and South America received 31% and 20% respectively.
On the supply side, U.S. domestic storage levels are below the historical average and natural gas production has been limited for a while as most upstream producers have adopted strict capital discipline. In addition, Hurricane Ida caused shutdowns of more than 90% of Gulf Coast natural gas production by late August. Subsequently, the combination of tightened supplies and the surge in LNG exports has exacerbated the upward pressure on Henry Hub natural gas prices.
The U.S. acts as the world swing producer primarily due to its ability to either increase or decrease its flexible-contracted exports in response to market conditions. The LNG margin or arbitrage drives the destination of U.S. LNG cargoes. The evidence of this dynamic was previously manifested in Summer 2020 when many LNG cargoes were canceled due to pandemic related demand destruction in importing countries.
Gas-to-Oil & Gas-to-Coal Switching
The rise of natural gas prices has started to impact crude oil markets. With gas prices at current levels, some analysts believe that oil-fired power generation could increase in Asia. JP Morgan estimates that gas-to-oil switching could lead to incremental demand of 750,000 barrels per day (bpd) of crude oil. The International Energy Agency (IEA) anticipates increased oil demand of 200,000 bpd.
In Asia, most power generation is coal-based, but coal markets face challenges of their own. Coal supply is constrained with less financing available, low inventories and supply chain issues – floods in Shanxi in central China have impacted domestic Chinese supply, and many Indian coal power plants have only limited coal reserves to run their plants.
European coal plants are now making a tentative comeback. The run-up in TTF prices has pushed coal generation units into the money, despite coal prices being at multi-year highs and EUA carbon prices remaining elevated (since coal power generation is more polluting than natural gas, higher carbon prices should favor natural gas over coal all else being equal). The switching potential is limited, however, with European countries having already closed or scheduled to close more than half their fleet of coal power plants.
Finding a New Balance
2020 LNG exports drove the U.S. trade balance in energy products to a surplus of $26 billion – the first surplus since at least 1974, according to the EIA and the U.S. Census Bureau’s trade value data. While exporting U.S. LNG cargoes brings an array of economic and strategic advantages, it has also tethered the U.S natural gas system to global dynamics with its ups and downs. In Europe, meanwhile, a combination of short- and long-term factors has pushed local prices to unprecedented levels. The question is when will the market find a new balance? A key variable will be the temperature over the coming winter months, as well as any new development with regards to Nordstream 2 and Russian gas deliveries.
—
Originally Posted on October 21, 2021 – What is Driving the Rally in Global Gas Prices?
Disclosure: Interactive Brokers
Information posted on IBKR Campus that is provided by third-parties does NOT constitute a recommendation that you should contract for the services of that third party. Third-party participants who contribute to IBKR Campus are independent of Interactive Brokers and Interactive Brokers does not make any representations or warranties concerning the services offered, their past or future performance, or the accuracy of the information provided by the third party. Past performance is no guarantee of future results.
This material is from CME Group and is being posted with its permission. The views expressed in this material are solely those of the author and/or CME Group and Interactive Brokers is not endorsing or recommending any investment or trading discussed in the material. This material is not and should not be construed as an offer to buy or sell any security. It should not be construed as research or investment advice or a recommendation to buy, sell or hold any security or commodity. This material does not and is not intended to take into account the particular financial conditions, investment objectives or requirements of individual customers. Before acting on this material, you should consider whether it is suitable for your particular circumstances and, as necessary, seek professional advice.
Disclosure: Forex
There is a substantial risk of loss in foreign exchange trading. The settlement date of foreign exchange trades can vary due to time zone differences and bank holidays. When trading across foreign exchange markets, this may necessitate borrowing funds to settle foreign exchange trades. The interest rate on borrowed funds must be considered when computing the cost of trades across multiple markets.
Disclosure: Futures Trading
Futures are not suitable for all investors. The amount you may lose may be greater than your initial investment. Before trading futures, please read the CFTC Risk Disclosure. A copy and additional information are available at ibkr.com.


