

")


1/ S&P 500 Closes in on Support
2/ The Nasdaq has a Ways to Go Lower
3/ Big Reversal Lower in the Dow
4/ Watch the Mids & Smalls for Clues
Investopedia is partnering with CMT Association on this newsletter. The contents of this newsletter are for informational and educational purposes only, however, and do not constitute investing advice. The guest authors, which may sell research to investors, and may trade or hold positions in securities mentioned herein do not represent the views of CMT Association or Investopedia. Please consult a financial advisor for investment recommendations and services.
1/ S&P 500 Closes in on Support
Within our models at Column E Advisors, we have been bearish on the short term direction of the S&P 500 since July when the Fed last hiked and moved the rate markets into an overly tight state. Combined with a drop in liquidity, which our fair-value models are built around, equity owners began to sell, pushing the momentum of stocks lower.

This was another down week for the S&P 500 but support is nearby (within 10 points) which should make this a key week for both the bears and the bulls. Last year at this time, equity markets were readying for a 6-month rally that ended in dramatic fashion in the spring with the banks. Will another 6-month rally spawn from this area or is a much more significant drop in the cards? Our internal models remain bearish and positioned accordingly.
2/ The Nasdaq Has a Ways to Go Lower
So the question is will the lack of support in the Nasdaq 100 lead to much greater declines in the other majors we are discussing here? Interestingly, heading into the end of the week, within our 3L’s strategies, tech stocks were being bought on the dives lower in the majors. Whether this was driven by the gains in Netflix or something else, the tech positions within our strategies did not sell off easily (Netflix was strong for the week).

For the Nasdaq 100, the failure at the 20-week, this and last week, argues that the next move is to the bottom of the range at 13,795, which is not only the 65-week moving average, but also a significant range support within our studies. Breadth has remained strong within this index but in a market looking for bottoms, breadth must show some more weakness, indicating the bulls are done buying the dip.
3/ Big Reversal Lower in the Dow
Like the other majors, the Dow Industrials also pivoted lower off a major moving average (65-week). This was also an outside candle down which is significant in terms of momentum – it typically argues that lower prices are coming when it shows. The first support comes in around fair value at 32k but the bigger support is the range sub 30k. This argues the blue chips could decline more than 10% from here, which could lead to more significant selling in stocks.

Breadth for the Dow also has been very weak and turned lower. Our power model, which includes the 65-week moving average and a measure of breadth, turned lower today for the first time since January of 2022. That turn was followed by a lousy year for stocks. Is this the recipe going forward vs the positive vibes of a bounce that the S&P possibly put on the table?
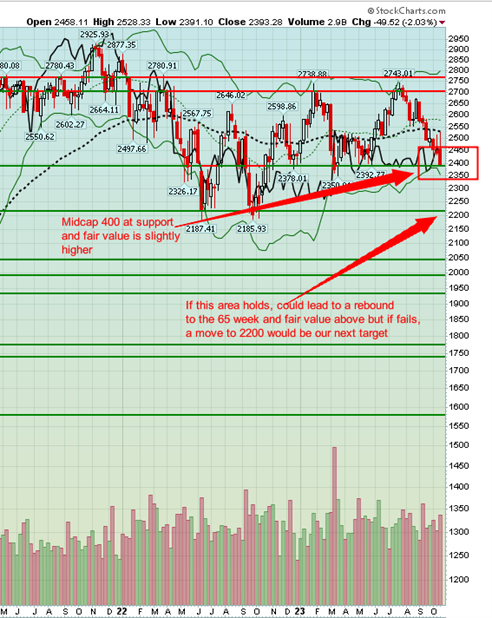
4/ Watch the Mids & Smalls for Clues
The last two charts are significant but not necessarily on their direction but for a call on risk. Small cap stocks are typically the most risky and, in this market mid-caps carry a similar distinction. If they are steady (neither rising nor falling), this has led to a positive backdrop for the other three major indexes. When they decline, this has led to flat to lower performance across the majors. In short, their positioning this week, will dictate what comes next for the S&P 500, Dow and Nasdaq 100.
For the Small-Cap 600, the break of 1100, on the surface argues for a much larger decline towards 975 (10%, like the Dow). If this does play out, “risk off” across “risk assets” will rise and panic may follow. For the Mid-Cap 400, this index resembles that of the S&P 500, right above significant range support around 2400. In short, if the Mid-Cap can hold and the Small-Cap 600 reverses higher, with the same occurring for the S&P 500, the markets could set themselves up for a nice bounce into year end. Conversely, a failure by the Mid-Cap 400 and the S&P 500, could lead the bulls to exit stage level, in similar fashion to 2018.

—
Originally posted 23d October 2023
Disclosure: Investopedia
Investopedia.com: The comments, opinions and analyses expressed herein are for informational purposes only and should not be considered individual investment advice or recommendations to invest in any security or to adopt any investment strategy. While we believe the information provided herein is reliable, we do not warrant its accuracy or completeness. The views and strategies described on our content may not be suitable for all investors. Because market and economic conditions are subject to rapid change, all comments, opinions and analyses contained within our content are rendered as of the date of the posting and may change without notice. The material is not intended as a complete analysis of every material fact regarding any country, region, market, industry, investment or strategy. This information is intended for US residents only.
Disclosure: Interactive Brokers
Information posted on IBKR Campus that is provided by third-parties does NOT constitute a recommendation that you should contract for the services of that third party. Third-party participants who contribute to IBKR Campus are independent of Interactive Brokers and Interactive Brokers does not make any representations or warranties concerning the services offered, their past or future performance, or the accuracy of the information provided by the third party. Past performance is no guarantee of future results.
This material is from Investopedia and is being posted with its permission. The views expressed in this material are solely those of the author and/or Investopedia and Interactive Brokers is not endorsing or recommending any investment or trading discussed in the material. This material is not and should not be construed as an offer to buy or sell any security. It should not be construed as research or investment advice or a recommendation to buy, sell or hold any security or commodity. This material does not and is not intended to take into account the particular financial conditions, investment objectives or requirements of individual customers. Before acting on this material, you should consider whether it is suitable for your particular circumstances and, as necessary, seek professional advice.


Join The Conversation
If you have a general question, it may already be covered in our FAQs. If you have an account-specific question or concern, please reach out to Client Services.