


")


By Todd Stankiewicz CMT, CFP, ChFC
1/ Fed Rate Cutting Expectations Ease
2/ Commodities are Leading the Way
3/ US Dollar may be Exhausted
Investopedia is partnering with CMT Association on this newsletter. The contents of this newsletter are for informational and educational purposes only, however, and do not constitute investing advice. The guest authors, which may sell research to investors, and may trade or hold positions in securities mentioned herein do not represent the views of CMT Association or Investopedia. Please consult a financial advisor for investment recommendations and services.
1/
Fed Rate Cutting Expectations Ease
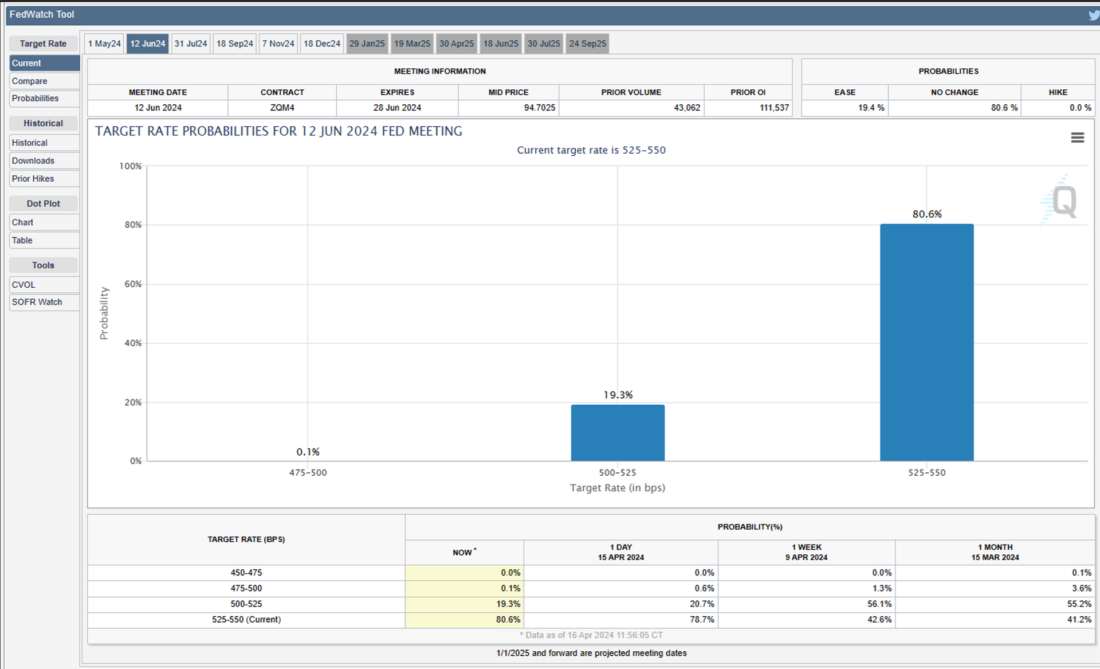
The recent spike in market volatility may be related to the reality that the market is rapidly adjusting the expectations that the FOMC will be cutting Fed Funds rate. Earlier in the year it was expected that the FOMC would cut rates 6 times this year. This has now decreased to the expectation of just 2 to 3 rate cuts now. The CME Fed Watch Tool displays how the rate cut expectation for June have declined from 55.2% one month ago, to just 19.3% today. Continued shifts in rate cutting expectation can lead to continued uncertainty and volatility in the equity and fixed income markets.
2/
Commodities are Leading the Way

Relative Rotation Graphs (RRG) are a useful tool for seeing how multiple markets are trading relative to a central index, such as the S&P500 in this case. The top left quadrant represents improving sectors relative to the S&P500 index. Many of the improving indices on a relative basis are commodity-based indices. All the while, the equity growth leaders are rolling over. This may suggest that there is more inflation on the way and the expectation for future rate cuts could potentially decline further.
3/
US Dollar may be Exhausted

After a very strong rally, the US dollar Bullish ETF (UUP), a proxy for the US dollar index, may be exhausted. It has recently hit an RSI of 77.81. This is technically overbought. When the ETF has hit previous RSI readings in this range, it has indicated a meaningful topping formation. Assets that benefit from a declining dollar, such as international equities and bonds, may offer opportunity if the US dollar does reverse course.
—
Originally posted 17th April, 2024
Disclosure: Investopedia
Investopedia.com: The comments, opinions and analyses expressed herein are for informational purposes only and should not be considered individual investment advice or recommendations to invest in any security or to adopt any investment strategy. While we believe the information provided herein is reliable, we do not warrant its accuracy or completeness. The views and strategies described on our content may not be suitable for all investors. Because market and economic conditions are subject to rapid change, all comments, opinions and analyses contained within our content are rendered as of the date of the posting and may change without notice. The material is not intended as a complete analysis of every material fact regarding any country, region, market, industry, investment or strategy. This information is intended for US residents only.
Disclosure: Interactive Brokers
Information posted on IBKR Campus that is provided by third-parties does NOT constitute a recommendation that you should contract for the services of that third party. Third-party participants who contribute to IBKR Campus are independent of Interactive Brokers and Interactive Brokers does not make any representations or warranties concerning the services offered, their past or future performance, or the accuracy of the information provided by the third party. Past performance is no guarantee of future results.
This material is from Investopedia and is being posted with its permission. The views expressed in this material are solely those of the author and/or Investopedia and Interactive Brokers is not endorsing or recommending any investment or trading discussed in the material. This material is not and should not be construed as an offer to buy or sell any security. It should not be construed as research or investment advice or a recommendation to buy, sell or hold any security or commodity. This material does not and is not intended to take into account the particular financial conditions, investment objectives or requirements of individual customers. Before acting on this material, you should consider whether it is suitable for your particular circumstances and, as necessary, seek professional advice.

")

Join The Conversation
If you have a general question, it may already be covered in our FAQs. If you have an account-specific question or concern, please reach out to Client Services.