

")


By Todd Stankiewicz CMT, CFP, ChFC
1/ Rising Wedge Broken
2/ Long Bond Bullish Divergence
3/ U.S. Recession Probabilities Peaking
Investopedia is partnering with CMT Association on this newsletter. The contents of this newsletter are for informational and educational purposes only, however, and do not constitute investing advice. The guest authors, which may sell research to investors, and may trade or hold positions in securities mentioned herein do not represent the views of CMT Association or Investopedia. Please consult a financial advisor for investment recommendations and services.
1/
Rising Wedge Broken
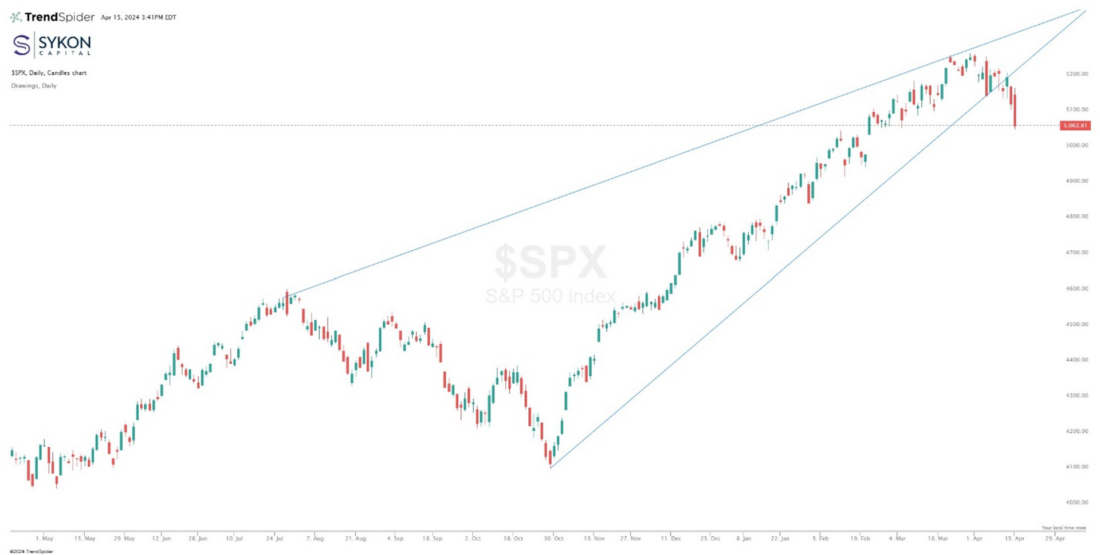
The S&P500 index has been forming a rising wedge pattern based off the July 2023 peak and October 2023 low. A rising wedge is traditionally a bearish reversal pattern and the SP&500 index has broken this pattern to the downside. The first support level comes into play at the February gap of 5032. The next support level is at the January gap and retest of 4954.
2/
Multiple Time Frames


These two charts look at the 14 period Average True Range of the S&P500 index. The top chart provides a daily view, while the bottom chart is the weekly view. After a period of a very contracted Average True Range, it has recently widened very quickly on the daily charts. The weekly charts still indicate that the overall Average True Range is contracted. Generally, the daily will lead the weekly indicator, increasing the probability that the weekly Average True Range may expand as the result of increased pressure to the downside on the weekly chart. This raises the potential for significant downside risk in the S&P500 index.
3/
U.S. Recession Probabilities Peaking

Twelve-month forward-looking recession probabilities are spiking to 58.31% looking forward to March of 2025. But the recession probabilities peak next month in May of 2024 at 70.85%. Remember this data is based on the 10-year minus 3-month treasury yield curve from 12 months ago. This spike is also coinciding with the newly reemerging market volatility. Just one more reason to be cautious.
—
Originally posted 16th April, 2024
Disclosure: Investopedia
Investopedia.com: The comments, opinions and analyses expressed herein are for informational purposes only and should not be considered individual investment advice or recommendations to invest in any security or to adopt any investment strategy. While we believe the information provided herein is reliable, we do not warrant its accuracy or completeness. The views and strategies described on our content may not be suitable for all investors. Because market and economic conditions are subject to rapid change, all comments, opinions and analyses contained within our content are rendered as of the date of the posting and may change without notice. The material is not intended as a complete analysis of every material fact regarding any country, region, market, industry, investment or strategy. This information is intended for US residents only.
Disclosure: Interactive Brokers
Information posted on IBKR Campus that is provided by third-parties does NOT constitute a recommendation that you should contract for the services of that third party. Third-party participants who contribute to IBKR Campus are independent of Interactive Brokers and Interactive Brokers does not make any representations or warranties concerning the services offered, their past or future performance, or the accuracy of the information provided by the third party. Past performance is no guarantee of future results.
This material is from Investopedia and is being posted with its permission. The views expressed in this material are solely those of the author and/or Investopedia and Interactive Brokers is not endorsing or recommending any investment or trading discussed in the material. This material is not and should not be construed as an offer to buy or sell any security. It should not be construed as research or investment advice or a recommendation to buy, sell or hold any security or commodity. This material does not and is not intended to take into account the particular financial conditions, investment objectives or requirements of individual customers. Before acting on this material, you should consider whether it is suitable for your particular circumstances and, as necessary, seek professional advice.


Join The Conversation
If you have a general question, it may already be covered in our FAQs. If you have an account-specific question or concern, please reach out to Client Services.