


By J.C. Parets & All Star Charts
1/ Big Level for the S&P 500
2/ Stocks Catch Lower
3/ Sellers Take Europe
4/ Rates and the Dollar Tarnish Gold
Investopedia is partnering with All Star Charts on this newsletter, which both sells its research to investors, and may trade or hold positions in securities mentioned herein. The contents of this newsletter are for informational and educational purposes only, however, and do not constitute investing advice.
1/ Big Level for the S&P 500
With U.S. equities under pressure the last few weeks, we’re looking to potential support levels for major indexes and sectors.
The chart below shows the S&P 500 retracing back to the 4,300 level:

This area of former resistance represents the August highs from last summer and the 61.8% Fibonacci retracement, making it a crucial level of interest.
We couldn’t think of a more logical place for bulls to step in and halt the recent sell-off. After rebounding off this level to close near the highs of day on Friday, we saw bullish follow-through as the S&P snapped its four-day losing streak with a 0.69% gain.
However, if sellers regain control and price violates this critical area, investors should be prepared for further downside and increased volatility. This kind of move would invalidate the reversal pattern that was completed in June.
2/ Stocks Catch Lower
Growth stocks are trading like they just found out that interest rates are headed higher and staying there longer. While tech indexes run into key overhead supply zones following a few quarters of big gains, we think there is more to the corrective action this month.
Interest rates in the United States are threatening to resolve higher from well-defined trading ranges. When interest rates trend higher, long-duration assets like growth stocks come under pressure. Alternatively, these stocks tend to perform well when rates are falling. This is why the chart of 20-Year+ Treasury Bonds (TLT) looks so much like the Nasdaq 100 (QQQ):

From the 2021 top to the lows during Q4 of last year, these charts have tracked each other very closely, peaking and bottoming together throughout the last cycle. However, beginning in the first quarter of this year, the relationship began to diverge as stocks screamed higher despite Treasuries rolling over.
With TLT closing at its lowest level in over a decade today, it will require a much steeper stock market correction before this divergence clears itself up. While the relationship may not go back to how strong it was in recent history, we don’t see growth stocks continuing higher in an environment where rates are rallying to new heights.
3/ Sellers Take Europe
Sellers have taken control abroad.
Overhead supply is a global phenomenon within equities as more and more countries run into logical levels of resistance.
An excellent example of this theme are the United Kingdom ETF (EWU) and the Italy ETF (EWI):
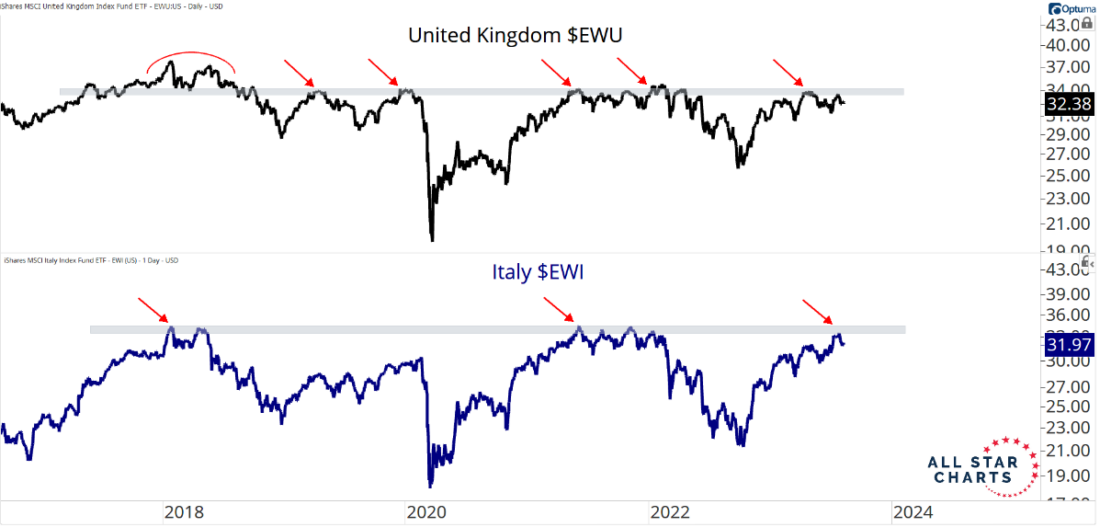
As you can see, they got rejected at a shelf of former highs, halting their advance.
This tells us that they need more time to consolidate and build up the fuel before buyers absorb overhead supply at these resistance levels. Until then, we expect further sideways action overseas.
4/ Rates and the Dollar Tarnish Gold
Gold is hanging on for dear life as it barely holds above its former 2011 highs (prior commodity supercycle peak).
And from the looks of the foreign exchange (FX) and bond markets, lower may be in the cards for the shiny yellow rock.
Check out the Chinese yuan overlaid with the U.S. 30-year Treasury bond futures in the upper pane and gold futures in the lower pane:

These three markets have followed each other closely over the past two years.
The upper pane highlights a relentless U.S. dollar (via the yuan) and rising interest rates by way of falling bond prices. Both create formidable headwinds for gold.
As long as the uptrends remain intact for yields and the U.S. dollar, it’s most likely messy for longer when it comes to precious metals. But the outlook for gold appears dim if and when it trades below its former 2011 peak.
—
Originally posted 21st August 2023
Disclosure: Investopedia
Investopedia.com: The comments, opinions and analyses expressed herein are for informational purposes only and should not be considered individual investment advice or recommendations to invest in any security or to adopt any investment strategy. While we believe the information provided herein is reliable, we do not warrant its accuracy or completeness. The views and strategies described on our content may not be suitable for all investors. Because market and economic conditions are subject to rapid change, all comments, opinions and analyses contained within our content are rendered as of the date of the posting and may change without notice. The material is not intended as a complete analysis of every material fact regarding any country, region, market, industry, investment or strategy. This information is intended for US residents only.
Disclosure: Interactive Brokers
Information posted on IBKR Campus that is provided by third-parties does NOT constitute a recommendation that you should contract for the services of that third party. Third-party participants who contribute to IBKR Campus are independent of Interactive Brokers and Interactive Brokers does not make any representations or warranties concerning the services offered, their past or future performance, or the accuracy of the information provided by the third party. Past performance is no guarantee of future results.
This material is from Investopedia and is being posted with its permission. The views expressed in this material are solely those of the author and/or Investopedia and Interactive Brokers is not endorsing or recommending any investment or trading discussed in the material. This material is not and should not be construed as an offer to buy or sell any security. It should not be construed as research or investment advice or a recommendation to buy, sell or hold any security or commodity. This material does not and is not intended to take into account the particular financial conditions, investment objectives or requirements of individual customers. Before acting on this material, you should consider whether it is suitable for your particular circumstances and, as necessary, seek professional advice.
Disclosure: ETFs
Any discussion or mention of an ETF is not to be construed as recommendation, promotion or solicitation. All investors should review and consider associated investment risks, charges and expenses of the investment company or fund prior to investing. Before acting on this material, you should consider whether it is suitable for your particular circumstances and, as necessary, seek professional advice.
Disclosure: Forex
There is a substantial risk of loss in foreign exchange trading. The settlement date of foreign exchange trades can vary due to time zone differences and bank holidays. When trading across foreign exchange markets, this may necessitate borrowing funds to settle foreign exchange trades. The interest rate on borrowed funds must be considered when computing the cost of trades across multiple markets.
Disclosure: Futures Trading
Futures are not suitable for all investors. The amount you may lose may be greater than your initial investment. Before trading futures, please read the CFTC Risk Disclosure. A copy and additional information are available at ibkr.com.


Join The Conversation
If you have a general question, it may already be covered in our FAQs. If you have an account-specific question or concern, please reach out to Client Services.