


![[Gamma] Scalping Please](https://ibkrcampus.com/wp-content/smush-webp/2024/04/tir-featured-8-700x394.jpg.webp "[Gamma] Scalping Please")


Veteran investors usually find most meaningful information about market price action to be underneath the surface. Dubbed “market internals”, these indicators give us a peek “under the hood” of the price dynamics: market breadth, sector leadership, momentum, etc. These can complete the picture of the current trend’s health. On that front, there were some notable positive developments last week.
We noted yesterday that the S&P 500 is currently sitting near the 200-week moving average that, in recent history, signaled proximity to a major low. Notably, in 2020 the index broke through that support but eventually – and in short order – rallied violently back above it.
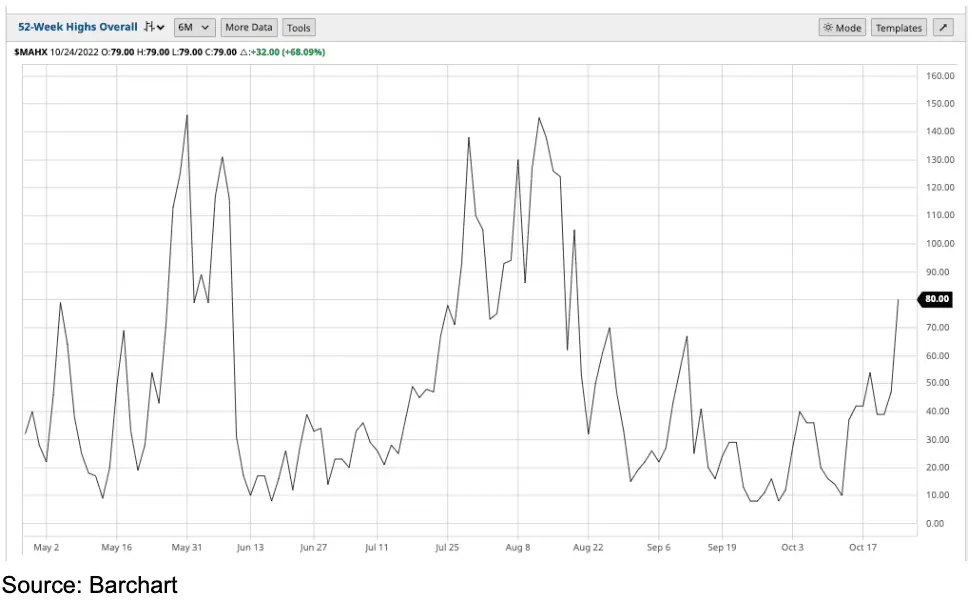
Similarly, market breadth (proxied by stocks making new 52-week highs or lows) has begun to improve very rapidly. The chart below shows the number of stocks that reach a new 52-week high in a given day.
Similarly, we had a few days when every sector or even every stock ended up higher on the day. That has led to some very punchy days. Bespoke group notes there have been only two years when the number of up 2% days exceeded 11: 2000 and 2008.
This year, we have had 12 such days already.
How meaningful are these improvements?
On their own, marginally positive. However, in the fast-evolving macro context they could be interpreted much more positively. Here is why.
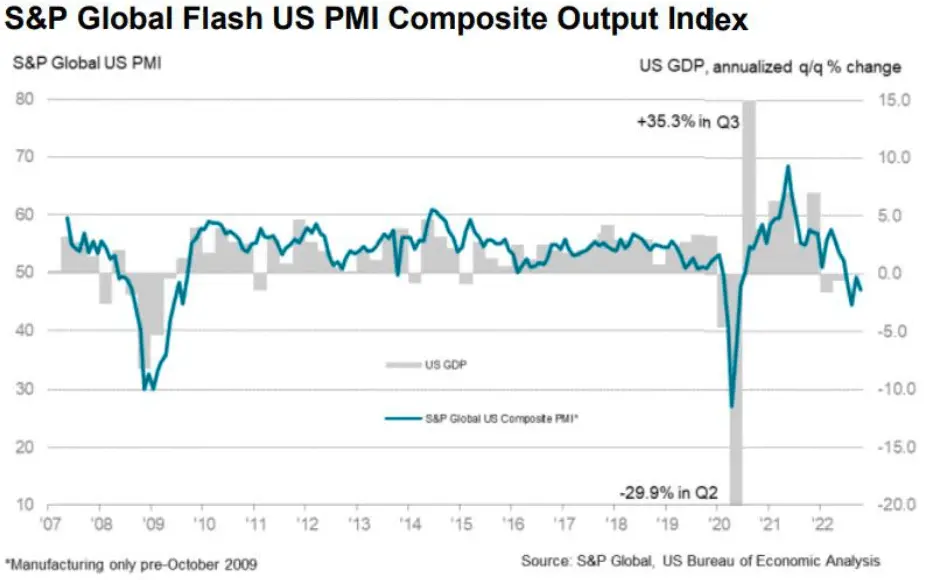
Last week, PMI data – surveying activity across a wide swath of industries – provided a high-frequency read on the US economy and the news was … bleak. But bleak in a good-ish kind of way. Bear with us for a second.
The PMI new orders index, the most forward looking component of the lot, showed a fast-accelerating downward momentum in activity (chart below). This is good because it shows the economy is cooling off faster than perhaps the Fed had assumed. And that might once again raise the specter of a “pivot” towards a slower pace of rate hikes (albeit a November 75 bps hike is more or less baked in.)
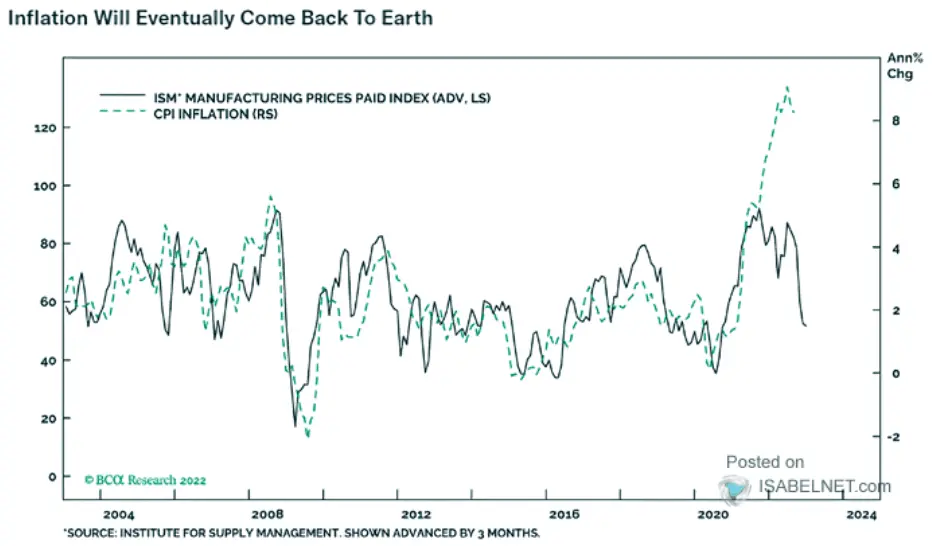
But it gets more encouraging. The underlying price index suggests that inflation could come down quite sharply in the not too distant future: probably 1-2 quarters. The relationship might not hold this time because the COVID dislocation ruined it forever.
If it does, however, that could provide the almost perfect set up for a market low. This week’s earnings will provide a lot more clues to economic activity: almost 25% of the S&P 500 market cap reports in the coming days.
Idea Spotlight: Microsoft
TOGGLE analyzed 6 similar occasions in the past where equity yield indicators for Microsoft dropped and historically, this led to a median increase in price.
Get ready – Big Tech earnings kick off today as both Microsoft and Alphabet report after market close. Here’s what you could expect post MSFT earnings:

—
Originally Posted October 25, 2022 – Market clues under the surface
Disclosure: Toggle AI
IB Global Investments LLC, a subsidiary of Interactive Broker Group Inc., the parent company of Interactive Brokers LLC, is a minority owner of Toggle AI.
Disclosure: Interactive Brokers
Information posted on IBKR Campus that is provided by third-parties does NOT constitute a recommendation that you should contract for the services of that third party. Third-party participants who contribute to IBKR Campus are independent of Interactive Brokers and Interactive Brokers does not make any representations or warranties concerning the services offered, their past or future performance, or the accuracy of the information provided by the third party. Past performance is no guarantee of future results.
This material is from Toggle AI and is being posted with its permission. The views expressed in this material are solely those of the author and/or Toggle AI and Interactive Brokers is not endorsing or recommending any investment or trading discussed in the material. This material is not and should not be construed as an offer to buy or sell any security. It should not be construed as research or investment advice or a recommendation to buy, sell or hold any security or commodity. This material does not and is not intended to take into account the particular financial conditions, investment objectives or requirements of individual customers. Before acting on this material, you should consider whether it is suitable for your particular circumstances and, as necessary, seek professional advice.
