


![[Gamma] Scalping Please](https://ibkrcampus.com/wp-content/smush-webp/2024/04/tir-featured-8-700x394.jpg.webp "[Gamma] Scalping Please")


- The oil and gas exploration and production Industry has shown low correlation to the broad market and high beta sensitivity to inflation
- Utilities may help investors navigate economic downturns and potentially benefit from the Inflation Reduction Act of 2022
- With Russia-Ukraine war triggering a paradigm shift in the global geopolitical landscape, the aerospace and defense industry may benefit from a new cycle of increased defense spending
With core CPI inflation and consumer inflation expectations near multi-decade highs,1 the Federal Reserve has raised the federal funds rates by 2.75% over the course of Q2, bringing the policy rate to its highest level since the global financial crisis. In September’s FOMC meeting, policymakers also raised their median projections for the terminal rate of this hiking cycle to 4.6% from June’s 3.8% and increased their core PCE inflation forecast for next year to 3.1%, indicating that tightening monetary policy and high inflation will likely be with us for a while.2
As the 10- and 2-year part of the curve remains inverted —flashing a warning sign of recession — earnings downgrades probably will continue and equity volatility is likely to be heightened in the near term. In this challenging market environment with looming recession risks, we favor industries with strong profitability or stable earnings, as well as beneficiaries of secular growth trends regardless where we are at the business cycle.
Oil and Gas Explorers and Producers: Portfolio Diversifiers with Strong Profitability and Attractive Valuations
Recessionary concerns and weak Chinese growth have weighed on oil prices since early June, sending WTI crude oil prices below $90 per barrel — more than 25% below their June peak. The oil and gas explorer and producer stocks, as a result, have given back some of their earlier gains, underperforming the broad market by more than 11% over the past three months.3
Recent weak performance combined with solid earnings fundamentals have led to more attractive valuations than earlier this year. The industry now trades at around a 70% discount to the S&P 500 based on forward 1-year price-to-earnings ratio, compared to 48% discount in January.4 Its attractive valuations, combined with strong profitability and tight oil and gas supply demand balance may create an attractive entry point for investors who are concerned about inflation and geopolitical uncertainties and want to add a diversifier to their equity portfolios.
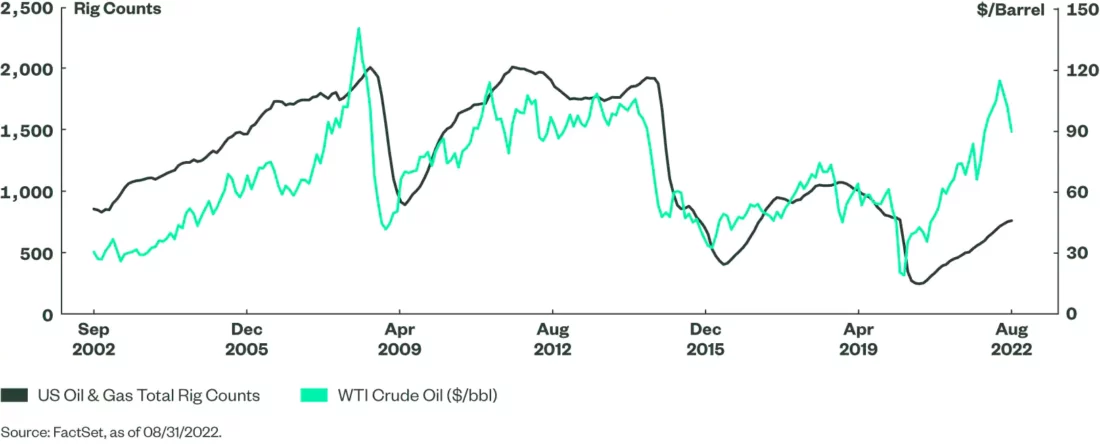
Despite recent weakness, oil and gas prices are still well above US producers’ breakeven point, supporting the industry’s profitability.5 Even given this year’s high energy commodity prices, US oil and gas explorers and producers have maintained capital discipline. As shown in the chart below, US oil and gas rig counts have barely recovered to their pre-pandemic level and remain well below those during previous oil peaks. Meanwhile, crude oil and natural gas inventories, whether including or excluding strategic petroleum reserve (SPR), are at or near their five-year lows heading into the fall season.6 Limited domestic supply amid continued global supply disruption due to the Russian-Ukraine war may support oil and gas prices this winter. Against this backdrop, energy companies continue leading earnings sentiment with strong Q2 earnings surprises and earnings upgrades for this and next year.7
US Rig Counts Remain Well Below Those During Previous Oil Peak
August stronger-than-expected CPI inflation data underscored persistent inflationary pressures. The oil and gas exploration and production industry has shown the greatest sensitivity to year-over-year CPI inflation among 21 S&P Select industries,8 presenting itself as a powerful tool to defend equity portfolios in an elevated inflation environment. In addition, the industry has had one of the lowest correlations to the broad market since inflation started surging last year,9 potentially providing diversification benefits and adding resilience to a core equity portfolio.
Utilities: A Defensive Sector that May Benefit from the Inflation Reduction Act
As economic growth has decelerated sharply and elevated labor and input costs pose headwinds to companies’ profit margins, analysts have been downgrading S&P 500 EPS estimates for this and next year since the start of Q3. However, the Utilities sector has shown a more stable earnings outlook. Since utilities generally pass fuel, operational and maintenance costs to customers and demand for their services is inelastic, high inflation has had little impact on the sector’s bottom line this year. In fact, Utilities is the only sector, barring Energy, that has seen earnings upgrades for this year and stable earnings for next year.10
Utilities’ defensive business nature has historically helped investors navigate economic downturns and market environments featuring a flattening yield curve. According to our sector business cycle analysis, Utilities outperformed the broad market during all past recession periods by an average of 11% and was one of the three best-performing sectors during recession. Utilities also has historically outperformed the broad market when the yield curve flattens , signaling weak economic growth prospects similar to the current market environment, as shown in the chart below. Over the past 15 years, when the yield curve flattened for the month, Utilities on average outperformed the S&P 500 Index by 1% for 63% of the time. This outperformance is the greatest and the most consistent among the 11 GICS sectors.
Utilities Have Outperformed When the Yield Curve Flattens

Besides near-term macroeconomic tailwinds, the sector may also benefit longer term from the recently passed Inflation Reduction Act of 2022 (IRA 2022). As one of the largest contributors to greenhouse gas emissions in the US, the Utilities sector has felt significant pressure to decarbonize. All of the S&P 500 utilities companies have set interim carbon reduction goals to achieve net zero by 2050 at the latest.11 To achieve those goals, capital expenditure, including investment in electric transmission infrastructure and new clean power generation, is estimated to account for approximately 13% of 2022-2024 spending in the electric, gas and multi-utilities industries.12 The production and investment tax credit incentives included in the IRA 2022 may help reduce the cost of utilities’ transition to renewable energy resources over the next decade. The addition of renewable assets may also help utilities align their generation mix with states’ environmental goals and customers’ interests, expanding their rate base and providing a new source of earnings growth over the long term.
Aerospace & Defense: A Potential Beneficiary of Increasing Global Defense Spending
After underperforming the broad market by 19% on an annualized basis between 2020 and 2021,13 US aerospace and defense stocks jumped on the heels of the Russia-Ukraine war in anticipation of increases in global defense spending, while the broad market was grappling with slower growth and higher inflation. Although the industry pulled back in Q2, the Russia-Ukraine war and rising tensions between the US and China on Taiwan provide significant secular tailwinds for the industry, as these events reflect a paradigm shift in the global geopolitical landscape and may start a new cycle of increasing defense spending globally.
US Share of Global Military Spending Declines as China’s Increases

Although the US spends more on defense than any other country in the world, its share of global military spending has declined over the past decade, while China’s share of global spending has steadily increased. Even compared to its own history, the yearly average of US military spending as a share of GDP over the past five years is the lowest since 2000.
The Russia-Ukraine war is a wakeup call for the US and its allies to sustain and strengthen their defense competitiveness. Rising tensions around the Taiwan Strait further reinforced bipartisan support for increasing the defense budget. In July, 180 Democrats and 149 Republicans in the House of Representatives joined forces to approve $37 billion more in defense spending than the $773 billion President Biden had requested for fiscal year 2023, which was already a 9.8% increase over the 2021 enacted level.14 Meanwhile, the Senate Armed Services Committee has backed a $45 billion increase over Biden’s proposal with bipartisan support and will bring it to the Senate floor for a vote later this year.15
In Europe, increases in defense spending have lagged behind the US, Russia and China.16 Since the start of the Russia-Ukraine war, European NATO countries have vowed to accelerate efforts to fulfil their commitment of reaching 2% of GDP on defense spending. Most notably, German lawmakers approved an amendment to the country’s constitution that will create a €100 billion special defense fund to help the country reach the quota over the next five years.17
To learn more about emerging sector investment opportunities, visit our dedicated sectors webpage.
Footnotes
1 University of Michigan Consumer Sentiment Survey, U.S. Bureau of Labor Statistics, as of August 31, 2022.
2 Summary of Economic Projections, the Federal Reserve, September 21, 2022.
3 FactSet, as of 9/14/2022.
4 FactSet, as of 8/31/2022.
5 Global crude oil cost curve shows 90% of projects through 2040 breaking even below $50/bbl, IHS Markit.
6 US Energy Information Administration.
7 FactSet, as of 9/14/2022. Compare growth estimates of S&P 500 sectors as of June 30th and September 14th.
8 FactSet, as of August 31, 2022. Based on 3-year beta to US headline and core CPI. The universe is S&P Select Industry indices.
9 Correlation is calculated for the period from 1/1/2021 to 8/31/2022 based on weekly returns of the S&P Select Industry indices and the S&P 500.
10 FactSet, as of 9/16/2022.
11 SPDR Research, S&P Global.
12 US utility renewable energy capex remains on upswing; 2022 forecast tops $19B, S&P Global, May 2022.
13 FactSet, as of August 31, 2022. The aerospace and defense industry are represented by the S&P Aerospace & Defense Select Industry index.
14 House passes $839B defense bill, swatting down Biden’s military plans, Politico, July 14, 2022. Budget of the U.S. Government Fiscal Year 2023.
15 Reed and Inhofe File Fiscal Year 2023 National Defense Authorization Act, July 18, 2022.
16 How European countries stand on 2% of GDP defense spending, Euronews, July 22, 2022.
17 German lawmakers approve 100 billion euro military revamp, Reuters, June 3, 2022.
Glossary
Consumer Price Index (CPI)
A widely used measure of inflation at the consumer level that helps to evaluate changes in cost of living. The CPI is composed of a basket of consumer goods and services across the economy and is calculated by the US Department of Labor by assessing price changes in the basket of goods and services and averaging them. Core CPI is the same series, minus food and energy prices, which are considered to be volatile enough to distort the meaning and usefulness of so-called headline CPI. The absence of food and energy, means the core series reflects long-term inflation trends more accurately.
Core Inflation
A measure of inflation that excludes certain items (food and energy) that move with more volatility that other price movements in the economy. Core inflation is considered to reflect the long-term trend in prices more accurately than so-called headline inflation that includes food and energy.
Earnings Per Share (EPS)
A profitability measure that is calculated by dividing a company’s net income by the number of shares outstanding.
Global Industry Classification Standard (GICS)
The Global Industry Classification Standard (GICS) is a method for assigning companies to a specific economic sector and industry group that best defines its business operations.
PCE Inflation (PCE)
PCE stands for Personal Consumption Expenditures. PCE is an inflation index that measures prices paid by consumers for good and services, excluding food and energy, and is maintained by the Bureau of Economic Analysis of the U.S. Department of Commerce. It is considered the Federal Reserve’s preferred inflation measure.
Sector Investing
An investor or portfolio that invests assets into one or more sector of the economy such as financials, energy, or health care.
S&P 500 Index
The S&P 500 Index is widely regarded as the best single gauge of large-cap U.S. equities and serves as the foundation for a wide range of investment products. The index includes 500 leading companies and captures approximately 80% coverage of available market capitalization.
—
Originally Posted October 4, 2022 – Sector Opportunities for Q4 2022
Disclosure
The views expressed in this material are the views of the Research and Strategy team through the period ended September 23, 2022, and are subject to change based on market and other conditions. This document contains certain statements that may be deemed forward-looking statements. Please note that any such statements are not guarantees of any future performance and actual results or developments may differ materially from those projected.
The information provided does not constitute investment advice and it should not be relied on as such. It should not be considered a solicitation to buy or an offer to sell a security. It does not take into account any investor’s particular investment objectives, strategies, tax status or investment horizon. You should consult your tax and financial advisor.
Unless otherwise noted, all data and statistical information were obtained from SSGA as of August 31, 2022. Data in tables have been rounded to whole numbers, except for percentages, which have been rounded to the nearest tenth of a percent.
All information is from SSGA unless otherwise noted and has been obtained from sources believed to be reliable, but its accuracy is not guaranteed. There is no representation or warranty as to the current accuracy, reliability or completeness of, nor liability for, decisions based on such information and it should not be relied on as such.
Investing involves risk including the risk of loss of principal.
Equity securities may fluctuate in value and can decline significantly in response to the activities of individual companies and general market and economic conditions.
Because of their narrow focus, sector investing tends to be more volatile than investments that diversify across many sectors and companies.
While the shares of ETFs are tradable on secondary markets, they may not readily trade in all market conditions and may trade at significant discounts in periods of market stress.
Non-diversified funds that focus on a relatively small number of securities tend to be more volatile than diversified funds and the market as a whole.
Concentrated investments in a particular sector or industry tend to be more volatile than the overall market and increases risk that events negatively affecting such sectors or industries could reduce returns, potentially causing the value of the Fund’s shares to decrease.
The whole or any part of this work may not be reproduced, copied or transmitted or any of its contents disclosed to third parties without SSGA’s express written consent.
Dow Jones and Dow Jones Total Stock Market Indexes are service marks of Dow Jones & Company, Inc. and have been licensed for use for certain purposes by State Street Bank and Trust. SPDR ETFs based on the Dow Jones Indexes, are not sponsored, endorsed, sold or promoted by Dow Jones and Dow Jones makes no representation regarding the advisability of investing in such product(s).
Disclosure: State Street Global Advisors
Do not reproduce or reprint without the written permission of SSGA.
All information has been obtained from sources believed to be reliable, but its accuracy is not guaranteed. There is no representation or warranty as to the current accuracy, reliability or completeness of, nor liability for, decisions based on such information and it should not be relied on as such.
State Street Global Advisors and its affiliates (“SSGA”) have not taken into consideration the circumstances of any particular investor in producing this material and are not making an investment recommendation or acting in fiduciary capacity in connection with the provision of the information contained herein.
ETFs trade like stocks, are subject to investment risk, fluctuate in market value and may trade at prices above or below the ETF’s net asset value. Brokerage commissions and ETF expenses will reduce returns.
Bonds generally present less short-term risk and volatility than stocks, but contain interest rate risk (as interest rates raise, bond prices usually fall); issuer default risk; issuer credit risk; liquidity risk; and inflation risk. These effects are usually pronounced for longer-term securities. Any fixed income security sold or redeemed prior to maturity may be subject to a substantial gain or loss.
Investing involves risk including the risk of loss of principal.
The whole or any part of this work may not be reproduced, copied or transmitted or any of its contents disclosed to third parties without SSGA’s express written consent.
Investing in high yield fixed income securities, otherwise known as “junk bonds”, is considered speculative and involves greater risk of loss of principal and interest than investing in investment grade fixed income securities. These Lower-quality debt securities involve greater risk of default or price changes due to potential changes in the credit quality of the issuer.
COPYRIGHT AND OTHER RIGHTS
Other third party content is the intellectual property of the respective third party and all rights are reserved to them. All rights reserved. No organization or individual is permitted to reproduce, distribute or otherwise use the statistics and information in this report without the written agreement of the copyright owners.
Definition:
Arbitrage: the simultaneous buying and selling of securities, currency, or commodities in different markets or in derivative forms in order to take advantage of differing prices for the same asset.
Fund Objectives:
SPY: The investment seeks to provide investment results that, before expenses, correspond generally to the price and yield performance of the S&P 500® Index. The Trust seeks to achieve its investment objective by holding a portfolio of the common stocks that are included in the index (the “Portfolio”), with the weight of each stock in the Portfolio substantially corresponding to the weight of such stock in the index.
VOO: The investment seeks to track the performance of a benchmark index that measures the investment return of large-capitalization stocks. The fund employs an indexing investment approach designed to track the performance of the Standard & Poor’s 500 Index, a widely recognized benchmark of U.S. stock market performance that is dominated by the stocks of large U.S. companies. The advisor attempts to replicate the target index by investing all, or substantially all, of its assets in the stocks that make up the index, holding each stock in approximately the same proportion as its weighting in the index.
IVV: The investment seeks to track the investment results of the S&P 500 (the “underlying index”), which measures the performance of the large-capitalization sector of the U.S. equity market. The fund generally invests at least 90% of its assets in securities of the underlying index and in depositary receipts representing securities of the underlying index. It may invest the remainder of its assets in certain futures, options and swap contracts, cash and cash equivalents, as well as in securities not included in the underlying index, but which the advisor believes will help the fund track the underlying index.
The funds presented herein have different investment objectives, costs and expenses. Each fund is managed by a different investment firm, and the performance of each fund will necessarily depend on the ability of their respective managers to select portfolio investments. These differences, among others, may result in significant disparity in the funds’ portfolio assets and performance. For further information on the funds, please review their respective prospectuses.
Entity Disclosures:
The trademarks and service marks referenced herein are the property of their respective owners. Third party data providers make no warranties or representations of any kind relating to the accuracy, completeness or timeliness of the data and have no liability for damages of any kind relating to the use of such data.
SSGA Funds Management, Inc. serves as the investment advisor to the SPDR ETFs that are registered with the United States Securities and Exchange Commission under the Investment Company Act of 1940. SSGA Funds Management, Inc. is an affiliate of State Street Global Advisors Limited.
Intellectual Property Disclosures:
Standard & Poor’s®, S&P® and SPDR® are registered trademarks of Standard & Poor’s® Financial Services LLC (S&P); Dow Jones is a registered trademark of Dow Jones Trademark Holdings LLC (Dow Jones); and these trademarks have been licensed for use by S&P Dow Jones Indices LLC (SPDJI) and sublicensed for certain purposes by State Street Corporation. State Street Corporation’s financial products are not sponsored, endorsed, sold or promoted by SPDJI, Dow Jones, S&P, their respective affiliates and third party licensors and none of such parties make any representation regarding the advisability of investing in such product(s) nor do they have any liability in relation thereto, including for any errors, omissions, or interruptions of any index.
BLOOMBERG®, a trademark and service mark of Bloomberg Finance, L.P. and its affiliates, and BARCLAYS®, a trademark and service mark of Barclays Bank Plc., have each been licensed for use in connection with the listing and trading of the SPDR Bloomberg Barclays ETFs.
Distributor: State Street Global Advisors Funds Distributors, LLC, member FINRA, SIPC, an indirect wholly owned subsidiary of State Street Corporation. References to State Street may include State Street Corporation and its affiliates. Certain State Street affiliates provide services and receive fees from the SPDR ETFs.
ALPS Distributors, Inc., member FINRA, is distributor for SPDR® S&P 500®, SPDR® S&P MidCap 400® and SPDR® Dow Jones Industrial Average, all unit investment trusts. ALPS Distributors, Inc. is not affiliated with State Street Global Advisors Funds Distributors, LLC.
Before investing, consider the funds’ investment objectives, risks, charges, and expenses. For SPDR funds, you may obtain a prospectus or summary prospectus containing this and other information by calling 1‐866‐787‐2257 or visiting www.spdrs.com. Please read the prospectus carefully before investing.
Disclosure: Interactive Brokers
Information posted on IBKR Campus that is provided by third-parties does NOT constitute a recommendation that you should contract for the services of that third party. Third-party participants who contribute to IBKR Campus are independent of Interactive Brokers and Interactive Brokers does not make any representations or warranties concerning the services offered, their past or future performance, or the accuracy of the information provided by the third party. Past performance is no guarantee of future results.
This material is from State Street Global Advisors and is being posted with its permission. The views expressed in this material are solely those of the author and/or State Street Global Advisors and Interactive Brokers is not endorsing or recommending any investment or trading discussed in the material. This material is not and should not be construed as an offer to buy or sell any security. It should not be construed as research or investment advice or a recommendation to buy, sell or hold any security or commodity. This material does not and is not intended to take into account the particular financial conditions, investment objectives or requirements of individual customers. Before acting on this material, you should consider whether it is suitable for your particular circumstances and, as necessary, seek professional advice.
Disclosure: Futures Trading
Futures are not suitable for all investors. The amount you may lose may be greater than your initial investment. Before trading futures, please read the CFTC Risk Disclosure. A copy and additional information are available at ibkr.com.
