


By: Jon Maier; Michelle Cluver, CFA; Damanick Dantes, CMT
In general, recessions are negative for energy stocks. This was evident during the 2008 financial crisis when oil prices dropped by approximately 75%.1 Focusing on the present situation, global economic growth is expected to continue, albeit with variations across regions. Europe entered a recession in Q1 2023, and the United States may face a mild recession in Q4 2023 or early 2024. However, emerging markets may continue growing. China’s reopening can counterbalance weaker demand from developed markets, and limited supply may support oil prices later this year.
Key Takeaways:
- Low inventory levels, supply cuts, and higher demand could boost oil prices.
- Greater capital discipline shifted focus from energy capex to dividends and buybacks.
- Peak pessimism could lead to positive earnings surprises among energy stocks.
Tighter Markets May Bolster Energy Markets
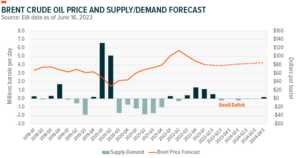
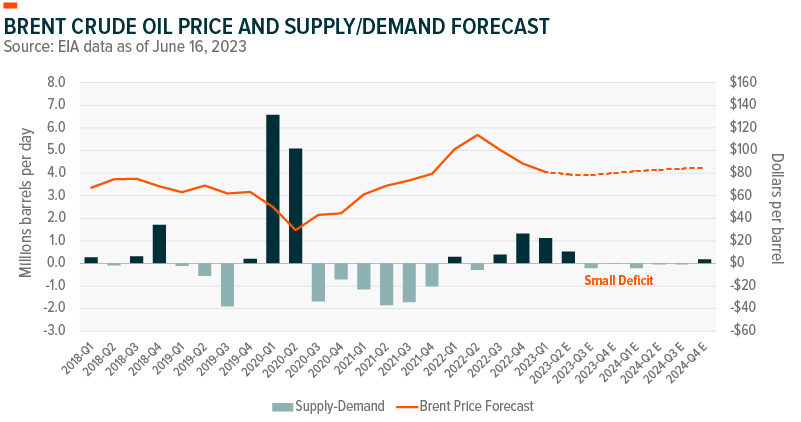
This cycle may be shaped by supply cuts and increasing demand. The U.S. Energy Information Administration (EIA) expects a minor production deficit to lift oil prices over the next few quarters. In June, the Organization of the Petroleum Exporting Countries (OPEC) agreed to extend oil production cuts until the end of 2024, and Arabia announced voluntary reductions of one million barrels per day for July 2023.2
Despite OPEC production cuts, the EIA expects global oil production to increase by 1.5 million barrels per day (b/d) this year and by 1.3 million b/d in 2024, but insufficient to keep up with demand. Consumption is forecasted to rise by 1.6 million b/d in 2023 and by an additional 1.7 million b/d in 2024. An expected decline in inventories through 2024 could lift the Brent oil price toward $79 per barrel this year and roughly $84 per barrel next year, according to EIA forecast.
China accounts for roughly 15-20% of total global oil demand, underscoring its importance in the global energy market.3 Despite China’s slower than expected recovery during the first half of this year, a series of interest rate cuts and possible government bond issuance could restore confidence. Even a weak reopening could drive higher energy demand relative to during their COVID-19 lockdowns. The International Energy Agency (IEA) expects China to account for roughly 60% of the expected increase in oil demand this year, and in April China’s oil demand set a record at 15 million b/d despite weaker than expected economic growth.4
As Europe approaches the winter season, higher energy consumption could amplify market imbalances and compete with Chinese demand. Asian gas prices are higher than the European benchmark, which makes selling U.S. liquid natural gas (LNG) to Asia more lucrative. The International Energy Agency (IEA) predicts that if prices continue to decline and economic activity rebounds, China’s LNG demand could surge by up to 35%.5
Energy Companies Focus on Capital Discipline
The traditional supply response to higher energy prices has been weaker during this energy cycle. Despite a nearly 50% increase in the WTI oil price in 2021 and a 7% rise in 2022, U.S. energy companies have prioritized returning cash to shareholders rather than raising capital expenditures.6 This is dissimilar to excess capacity and leverage that defined the 2008 and 2014 downcycles.
The increase in U.S. fracking technology from 2009 spurred a decade-long production boom that left many companies buried in debt. Since then, balance sheets have improved. Deloitte estimates that record profit growth in 2022 could wipe out nearly $300 billion of losses incurred from 2010 to 2019, freeing up more cash for shareholders.7
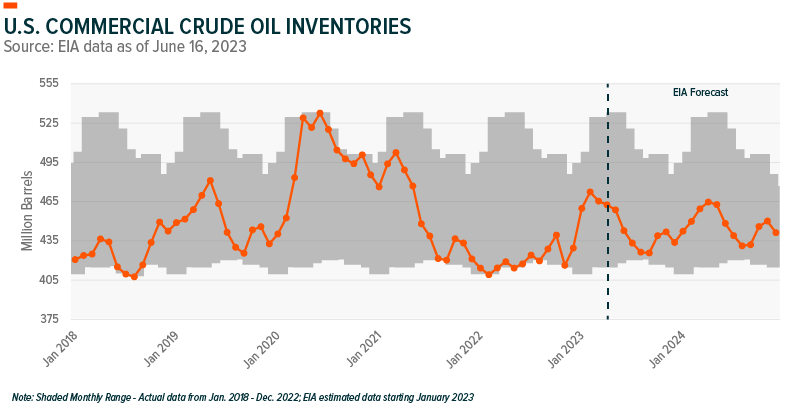
The aversion to capital spending is partly driven by higher production costs. The average cost of drilling and completing a well in the U.S. rose by 34% last year, which discouraged companies from adding additional capacity.8 The focus on financial health could cap U.S. oil inventory builds, potentially remaining at the low-end of the five-year range by EIA estimates.
Positioning in the Current Environment
Improving energy fundamentals may merit greater cyclical exposure than during a typical economic slowdown. Defensive sectors outperformed last year as investors sought refuge from rising recession risks. The valuation differential between defensive and cyclical stocks rose to the top 25% of its historical range as the S&P 500 slipped into an earnings recession in Q1 2023. Cyclicals tend to outperform after such wide valuation spreads.9
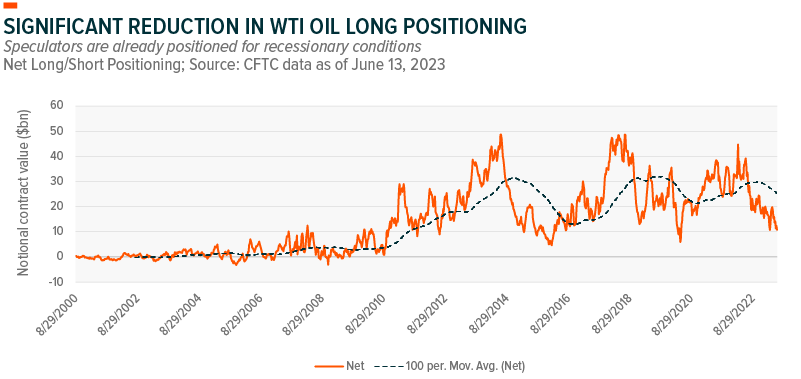
Energy stocks could participate in a cyclical rebound, especially given peak pessimism. Speculators in the WTI oil futures market have significantly trimmed their net-long positions over the past year, which typically precedes higher oil prices.10
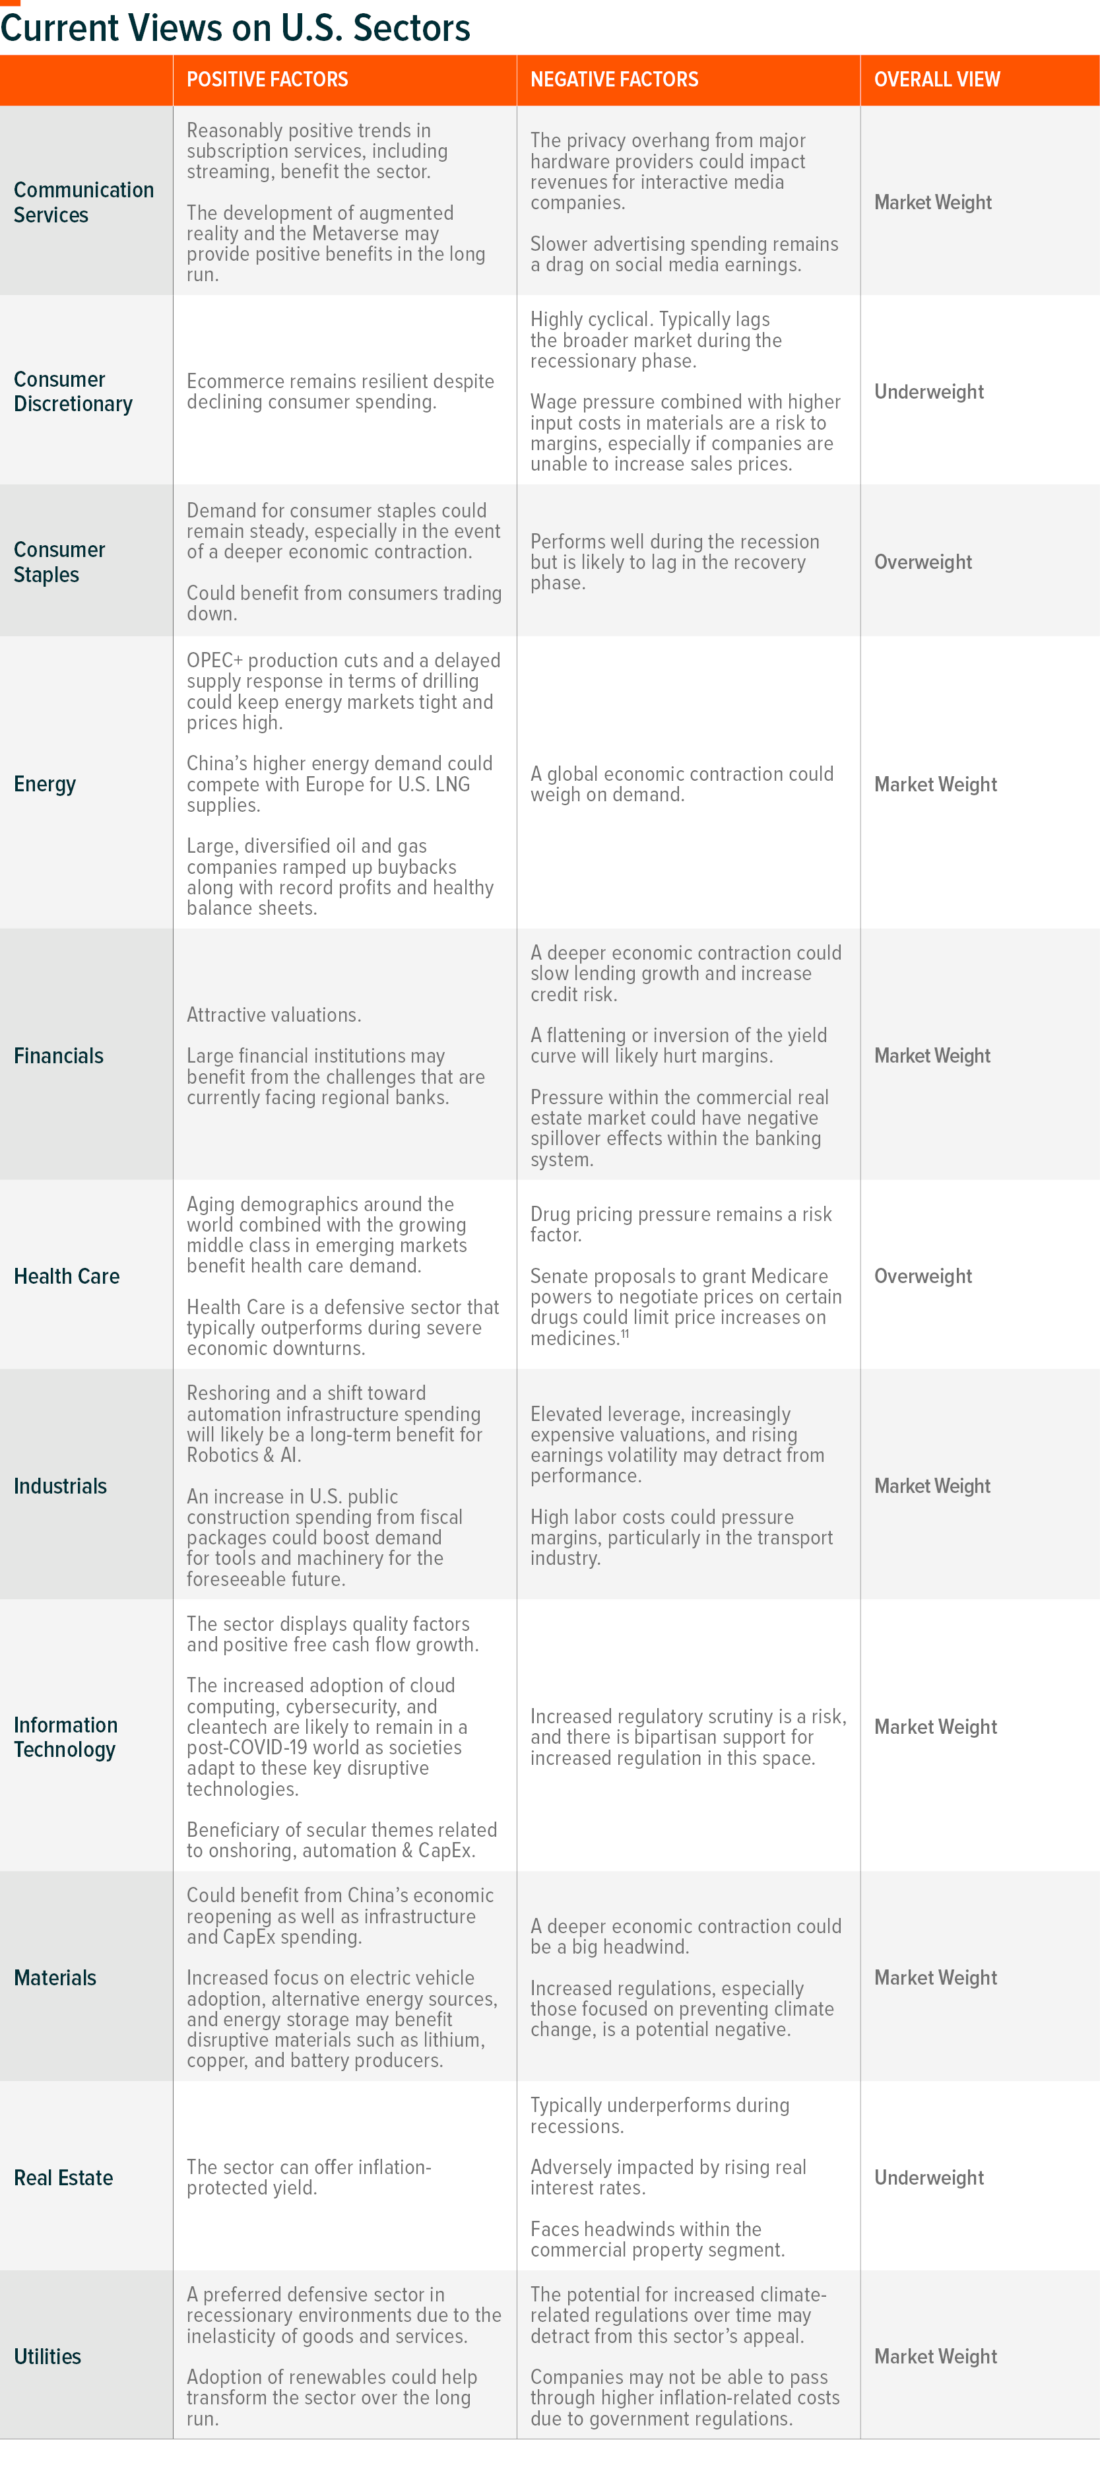
Our sector views table below provides more detail on positioning.
FOOTNOTES
- Bloomberg data as of June 27, 2023
- EIA, Short-Term Energy Outlook, June 6, 2023
- OilPrice.com, China Drives Rebound in Oil Demand, May 22, 2023
- Energy Intelligence, China’s Oil Demand Hits Another New High, May 26, 2023
- IEA, Natural Gas Markets to Remain Tight as Uncertainty Persists Around Chinese LNG Demand, February 28, 2023
- Bloomberg data as of June 23, 2023
- Bloomberg, US Shale Could Erase Debt by 2024, August 25, 2022
- Wood Mackenzie, Capital Discipline Raises Questions About US Oilfield Services, February 3, 2023
- Fidelity Investments, High Levels of Investor Fear Could Signal Opportunity, May 1, 2023
- CFTC data as of June 13, 2023
- CNBC, ‘Once-in-a-generation’ Prescription Drug Pricing Reform Could be Coming, July 29, 2022
GLOSSARY
Capital Expenditures (CapEx): Funds used by a company to acquire, update, and maintain physical assets such as buildings, technology, and equipment; often used to undertake new investments/projects.
S&P 500 Total Return Index: The index includes 500 leading U.S. companies and captures approximately 80% coverage of available market capitalization.
—
Originally Posted July 3, 2023 – Sector Views – Potential Resilience in Energy
This material represents an assessment of the market environment at a specific point in time and is not intended to be a forecast of future events, or a guarantee of future results. This information is not intended to be individual or personalized investment or tax advice and should not be used for trading purposes. Please consult a financial advisor or tax professional for more information regarding your investment and/or tax situation.
Global X Management Company LLC serves as an advisor to the Global X Funds.
Disclosure: Global X ETFs
Carefully consider the Fund’s investment objectives, risk factors, charges and expenses before investing. This and additional information can be found in the Fund’s full or summary prospectus, which may be obtained by calling 1-888-GX-FUND-1 (1.888.493.8631), or by visiting globalxfunds.com. Read the prospectus carefully before investing.
Disclosure: Interactive Brokers
Information posted on IBKR Campus that is provided by third-parties does NOT constitute a recommendation that you should contract for the services of that third party. Third-party participants who contribute to IBKR Campus are independent of Interactive Brokers and Interactive Brokers does not make any representations or warranties concerning the services offered, their past or future performance, or the accuracy of the information provided by the third party. Past performance is no guarantee of future results.
This material is from Global X ETFs and is being posted with its permission. The views expressed in this material are solely those of the author and/or Global X ETFs and Interactive Brokers is not endorsing or recommending any investment or trading discussed in the material. This material is not and should not be construed as an offer to buy or sell any security. It should not be construed as research or investment advice or a recommendation to buy, sell or hold any security or commodity. This material does not and is not intended to take into account the particular financial conditions, investment objectives or requirements of individual customers. Before acting on this material, you should consider whether it is suitable for your particular circumstances and, as necessary, seek professional advice.
Disclosure: Futures Trading
Futures are not suitable for all investors. The amount you may lose may be greater than your initial investment. Before trading futures, please read the CFTC Risk Disclosure. A copy and additional information are available at ibkr.com.

")

Join The Conversation
If you have a general question, it may already be covered in our FAQs. If you have an account-specific question or concern, please reach out to Client Services.