


This morning I was fortunate to participate in the inaugural Yahoo Finance Chartbook and to present my findings on-air. Mine was just one of 50 thought-provoking charts. In that spirit, I will offer three current charts of my own that influence my thinking about markets as we enter a seasonally difficult period.
The one that I offered is one that should be somewhat familiar to regular readers. It’s the one that shows the S&P rising during 2020-21 as the Federal Reserve expanded its balance sheet via quantitative easing (QE), then sinking in 2022 as the Fed reversed course and began shrinking its balance sheet via quantitative tightening (QT).
But notice the bump in the upper line – the total size of the Fed’s balance sheet unexpectedly jumped in March of this year. The reason was not a positive one. The Fed lent $300 billion to shore up jittery banks, and those loans showed up as assets on the balance sheet. Considering that the securities on the Fed’s balance sheet are also loans – securitized as government debt – the move was a stealth form of QE. We shouldn’t question the Fed’s need to stabilize the banking system, but the loans undid months of QT in one fell swoop.
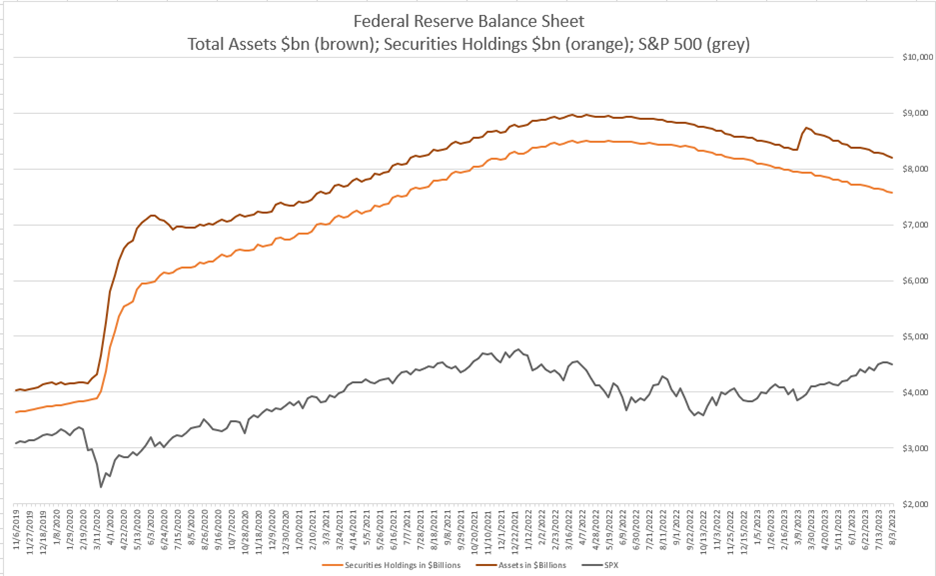
Sources: Interactive Brokers, Federal Reserve H.4.1 releases
Once the banking crisis abated, we first got a relief rally in equity markets, but it then morphed into something larger. During the ensuing months, the “Magnificent Seven” took off, propelled largely by AI fever, and as the rally broadened, we’ve even seen a return to meme-style investing. Remember, there is an inherent asymmetry in the market’s response to changes in monetary policy. Restrictive policies filter into stock prices with long and variable lags, but accommodation is incorporated within weeks, if not days.
Now that the balance sheet has retreated below it’s pre-March levels, the following questions are posed by a close read of the chart:
- How much of the current rally be attributed to the unexpected monetary stimulus, regardless of intent?
- Are equities now fighting the Fed? If so, how long can it continue?
For better or worse, the answers to the questions seem to be:
- Quite a bit
- Probably, and maybe not much longer
The evidence for the answer to the second question is in the following chart. It shows the Cboe Volatility Index (VIX) over the past two weeks. Note the spikes on July 27th, August 2nd and 4th, and the gap open on August 3rd.
VIX 2 Weeks, 10-Minute Bars
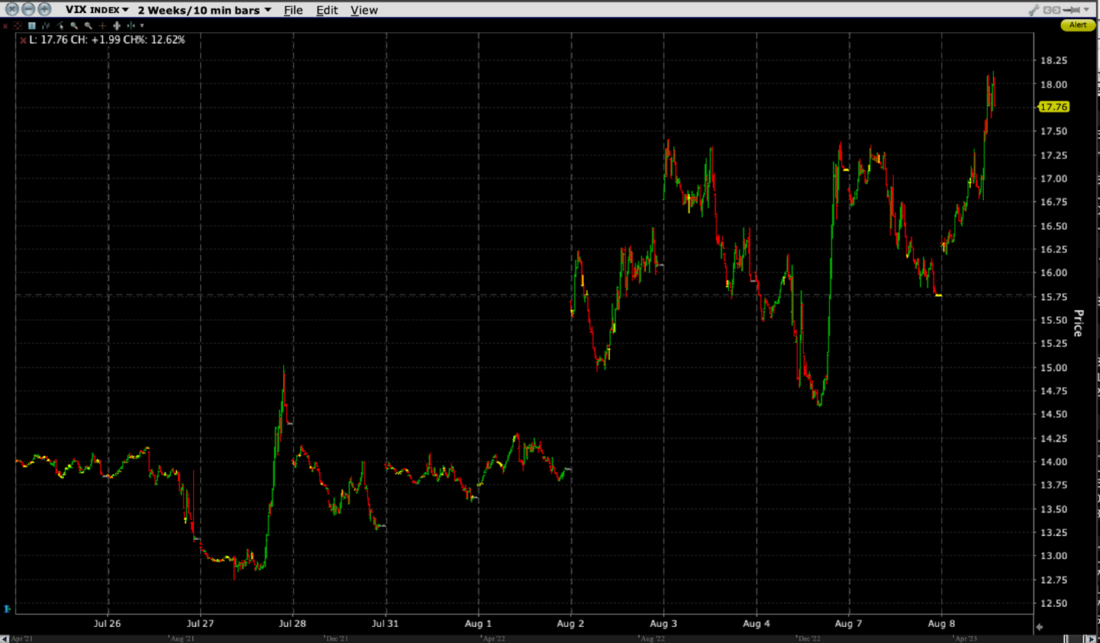
Source: Interactive Brokers
Big spikes in VIX mean that traders have quickly pivoted to risk aversion. Even though zero-dated options have attracted significant amounts of volume and mindshare, VIX remains the quickest way for institutions to hedge risk effectively.
The spikes tell me that traders are quickly reassessing their balance between greed and fear. Greed, or at least the lack of fear was evident as recently as July 27th. VIX was .01 above its year lows before reports of a potential Bank of Japan policy move hit the wires. We spiked a quick two points but gave much of the gains back on the next day. Yet since then, downward moves in the broad market have been met by quick spikes in VIX. Many investors, but hardly all, have a healthier respect for risk now than they did just two weeks ago.
Finally, I continue to mull over a chart I presented and discussed at length yesterday. It shows that while inverted yield curves are quite reliable, if infrequent, harbingers of future recessions, the recessions only begin after the inversion ends. (Much more in the linked piece)
2-Year / 10-Year Yield Spread, 30-Year Monthly Data, with Red/Green lines at the Beginning/End of NBER-defined Recessions, and 0% level highlighted (yellow)
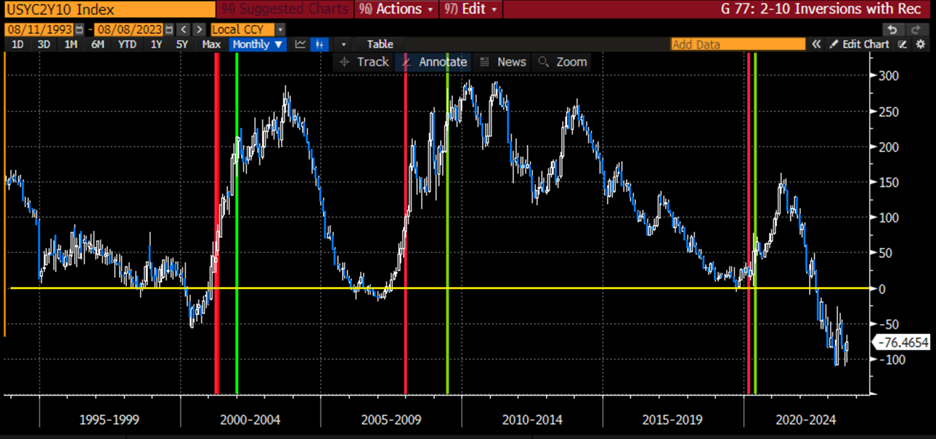
Source: Bloomberg
I had originally thought it was encouraging to see the yield curve make steps toward normalcy. Now that concerns me even more.
Join The Conversation
If you have a general question, it may already be covered in our FAQs. If you have an account-specific question or concern, please reach out to Client Services.
Leave a Reply
Disclosure: Interactive Brokers
The analysis in this material is provided for information only and is not and should not be construed as an offer to sell or the solicitation of an offer to buy any security. To the extent that this material discusses general market activity, industry or sector trends or other broad-based economic or political conditions, it should not be construed as research or investment advice. To the extent that it includes references to specific securities, commodities, currencies, or other instruments, those references do not constitute a recommendation by IBKR to buy, sell or hold such investments. This material does not and is not intended to take into account the particular financial conditions, investment objectives or requirements of individual customers. Before acting on this material, you should consider whether it is suitable for your particular circumstances and, as necessary, seek professional advice.
The views and opinions expressed herein are those of the author and do not necessarily reflect the views of Interactive Brokers, its affiliates, or its employees.


Another curious thing is that, over this period anyway, the spread widens around periods of recession and otherwise narrow. This even happened around the mini-recession of 2013. This invites an argument against a tenet of conventional wisdom, something like “these days, most borrowers tend to prefer short matureties, except when they’ve been recently burned. This creates a serious vulnerability of the economy to shocks (also evident in this chart).”
Thank you for sharing, Peter.