


![[Gamma] Scalping Please](https://ibkrcampus.com/wp-content/smush-webp/2024/04/tir-featured-8-700x394.jpg.webp "[Gamma] Scalping Please")


There are a number of horror stories accompanying the markets these days: surging inflation, slowing growth and spiking energy prices. Nevertheless, there is yet one more spine-tingling event coming up on October 31: Halloween! However, we are going to consider how you can use seasonality and statistical probability and pattern recurrence to strengthen your trading in light of Halloween.
The promising news is, that while there is something particularly spooky about this day, it actually marks the start of a period that tends to yield promising returns for investors.
According to the National Retail Federation, total Halloween spending, encompassing the costs of candy, costumes, decorations and greeting cards, is projected to reach $10.14 billion this year.
Besides short upcoming trends in the stocks of some popular candy retailers, costume sellers and movies (see Netflix) around Halloween, there is also a long lasting trend making its way in the coming weeks, the so-called “Halloween Effect”.
The Halloween Effect
It originated in the City of London in the late 16th century, and has been passed from trader to trader ever since. This widely discussed phenomenon has gone beyond the interest of seasonal experts, and has been discussed by numerous scholars, including Jacobsen & Visaltanachoti; Haggard & Witte; Maberly & Pierce; and many others. It does indeed have evidence worthy of consideration.
The Halloween Effect defines the tendency of the market to perform better from Nov. 1 to April 30 than it does over the other months.
In search of proof I have analysed a seasonal chart of the S&P 500 Index. It can be easily seen that over the past 25 years there is a strong seasonal tendency from October 26 to April 30.
Keep in mind that the seasonal chart shows the average price pattern of the stock calculated over recent years. The horizontal axis shows the time of the year, and the vertical axis shows the percentage changes in the value of the stock, or in our case indices (indexed to 100).
Seasonal pattern of S&P 500 over the past 25 years
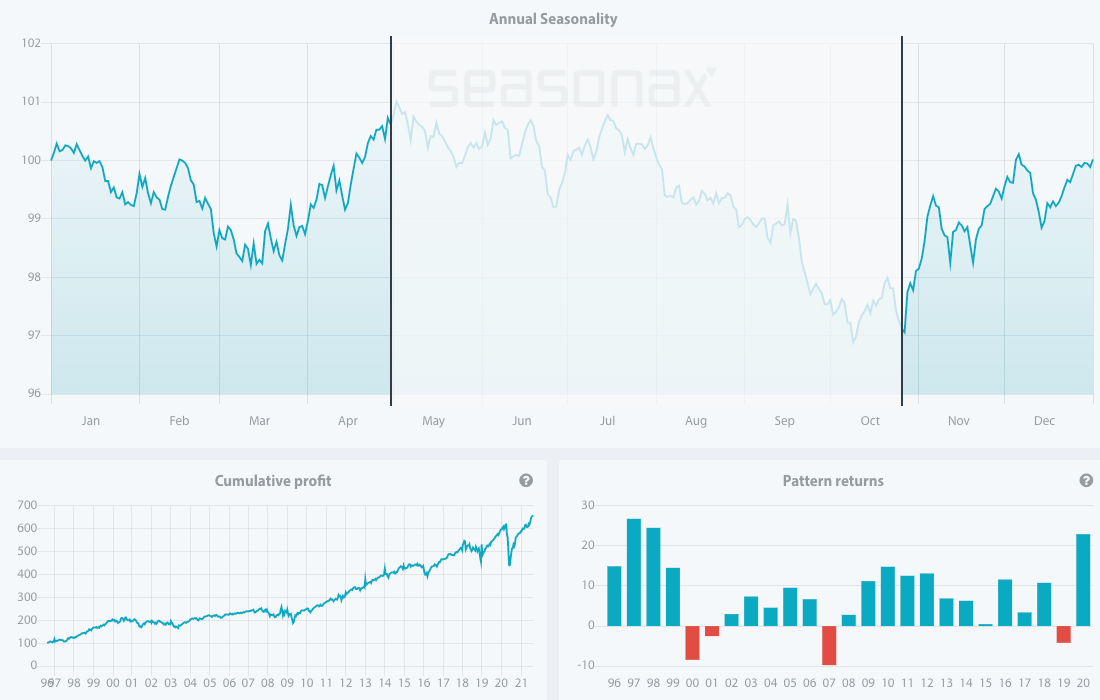
Source: Seasonax – by clicking on the chart you will be able to analyse different time periods in the chart
What Causes the Halloween Effect?
The retail sector, with the upcoming holiday shopping season, is one of the drivers of the surge in stocks in coming months. Halloween is just one of the sales events that unleash additional spending. Next in line is Black Friday, which is also set to contribute to driving stock prices up, as well as the traditional year-end stock rally and investor sentiment during the festive season.
Retailers and the entertainment industry will surge high in demand in the upcoming months. With this is mind, let’s look at the seasonal chart of Caesars Entertainment Corporation, which engages in the provision of casino-entertainment and hospitality services. Its brands include Aesars, Harrahs, Horseshoe, Wsop, Linq, Caesars and Paris.
From the chart, I can conclude that over the past 10 years, it has entered into a strong seasonal period from October 28 to December 30. In this time span of 43 trading days, shares rose by astonishing 20.97% on average.
Seasonal pattern of Caesars Entertainment Corporation over the past 10 years
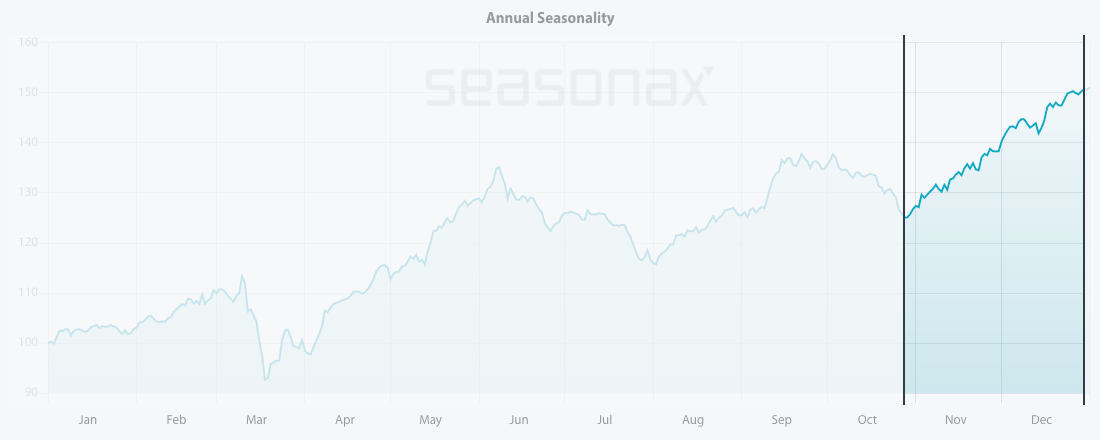
Source: Seasonax – by clicking on the chart you can conduct further analysis.
Moreover, the pattern returns in that period have been consistent and positive since 2011, with just one outlier year in 2014, when the stock posted an insignificant loss of 0.01 percent during the period under review.
Pattern return for every year since 2011
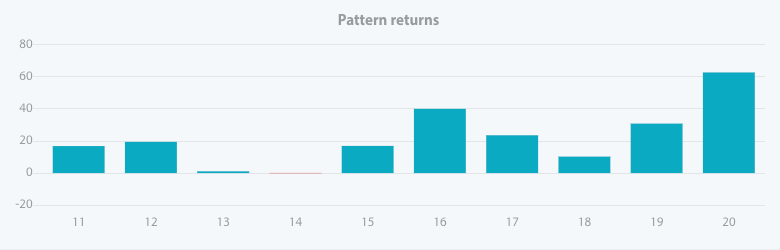
Source: Seasonax – click on the chart to conduct further analysis
Whether the trend will continue in 2021 cannot be predicted with certainty, but seasonality allows us to determine the probability of certain price moves. As a trading strategy, it is one of just a few approaches that are statistically verifiable. Since the calendar-based drivers underlying seasonal trends are independent of other driving factors, seasonality consistently creates added value for investors from a statistical perspective. In other words, you can incorporate seasonality and this use of statistical probability and pattern recurrence into the trading approaches you have employed so far. Maybe Halloween can be more treat than trick!
Enter the world of seasonal opportunities
There are many more stocks that are entering into their short or long strong seasonal periods.
Feel free to analyze more than 25.000+ instruments including stocks, (crypto)currencies, commodities, indexes by signing up to a free 3-day trial.
—
Originally Posted on October 20, 2021 – Trick or Treat on The Stock Markets
Disclosure: Seasonax
Past results and past seasonal patterns are no indication of future performance, in particular, future market trends. Seasonax GmbH neither recommends nor approves of any particular financial instrument, group of securities, segment of industry, analysis interval or any particular idea, approach, strategy or attitude nor provides consulting nor brokerage nor asset management services. Seasonax GmbH hereby excludes any explicit or implied trading recommendation, in particular, any promise, implication or guarantee that profits are earned and losses excluded, provided, however, that in case of doubt, these terms shall be interpreted in abroad sense. Any information provided by Seasonax GmbH or on this website or any other kind of data media shall not be construed as any kind of guarantee, warranty or representation, in particular as set forth in a prospectus. Any user is solely responsible for the results or the trading strategy that is created, developed or applied. Indicators, trading strategies and functions provided by seasonax GmbH or on this website or any other kind of data media may contain logical or other errors leading to unexpected results, faulty trading signals and/or substantial losses. Seasonax GmbH neither warrants nor guarantees the accuracy, completeness, quality, adequacy or content of the information provided by it or on this website or any other kind of data media. Any user is obligated to comply with any applicable capital market rules of the applicable jurisdiction. All published content and images on this website or any other kind of data media are protected by copyright. Any duplication, processing, distribution or any form of utilisation beyond the scope of copyright law shall require the prior written consent of the author or authors in question. Futures and forex trading contains substantial risk and is not for every investor. An investor could potentially lose all or more than the initial investment. Risk capital is money that can be lost without jeopardizing ones’ financial security or lifestyle. Only risk capital should be used for trading and only those with sufficient risk capital should consider trading. Past performance is not necessarily indicative of future results. Testimonials appearing on this website may not be representative of other clients or customers and is not a guarantee of future performance or success.
Disclosure: Interactive Brokers
Information posted on IBKR Campus that is provided by third-parties does NOT constitute a recommendation that you should contract for the services of that third party. Third-party participants who contribute to IBKR Campus are independent of Interactive Brokers and Interactive Brokers does not make any representations or warranties concerning the services offered, their past or future performance, or the accuracy of the information provided by the third party. Past performance is no guarantee of future results.
This material is from Seasonax and is being posted with its permission. The views expressed in this material are solely those of the author and/or Seasonax and Interactive Brokers is not endorsing or recommending any investment or trading discussed in the material. This material is not and should not be construed as an offer to buy or sell any security. It should not be construed as research or investment advice or a recommendation to buy, sell or hold any security or commodity. This material does not and is not intended to take into account the particular financial conditions, investment objectives or requirements of individual customers. Before acting on this material, you should consider whether it is suitable for your particular circumstances and, as necessary, seek professional advice.
