


")


Think back to those nervous days of … checks notes … a week ago. Stock traders were gloomy amidst grim news from Ukraine and ahead of an FOMC meeting. Since then, the news from Ukraine remains grim, but Chairman Powell successfully reprised his role as “Goldilocks in a Suit” – at least as far as equity investors were concerned. From Monday’s close to Friday’s, the S&P 500 Index (SPX) rose nearly 7% and the NASDAQ 100 (NDX) rose over 10%. Stocks had a good year last week:
6 Day Chart, 5 Minute Bars, March 14-21st, SPX (green/red), NDX (blue)
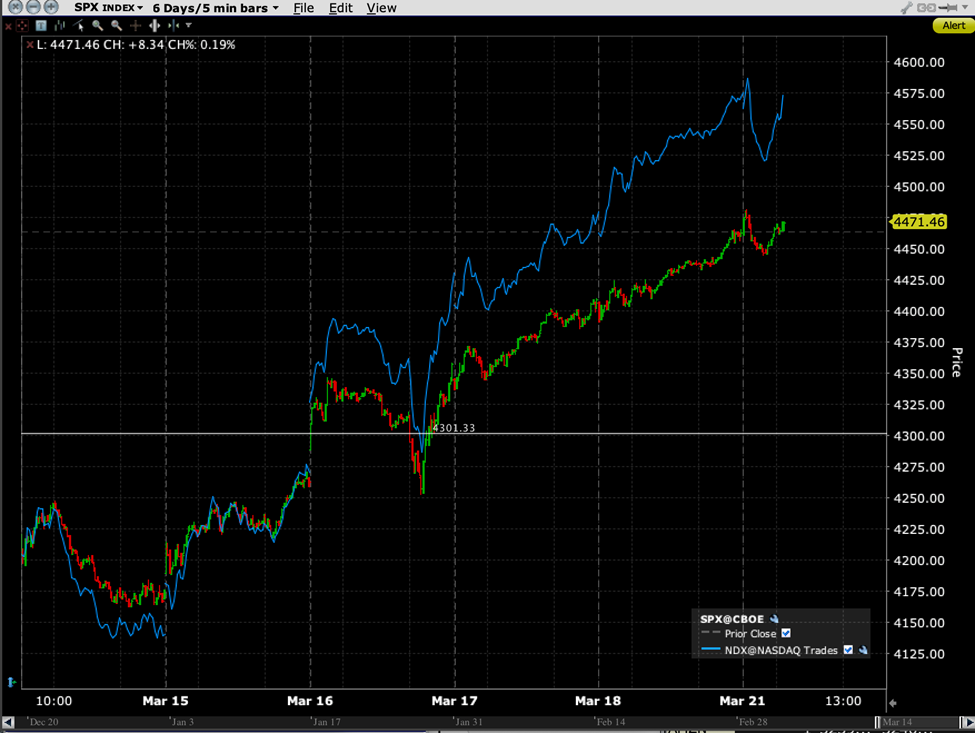
Source: Interactive Brokers
While we were prescient enough on March 10th to opine “There is reason for bulls, or at least dip-buyers, to eye next week’s FOMC announcement”, we then wondered on Wednesday “whether traders have gotten ahead of themselves yesterday and this morning in pricing in a bounce.” Although we are well aware that some of the largest upward market moves can occur within the context of a down market, the change in sentiment was quite impressive nonetheless. Note the move in the VIX (CBOE Volatility Index) futures curve over just a week:
VIX Futures Curves, 1 Week Ago vs. Current
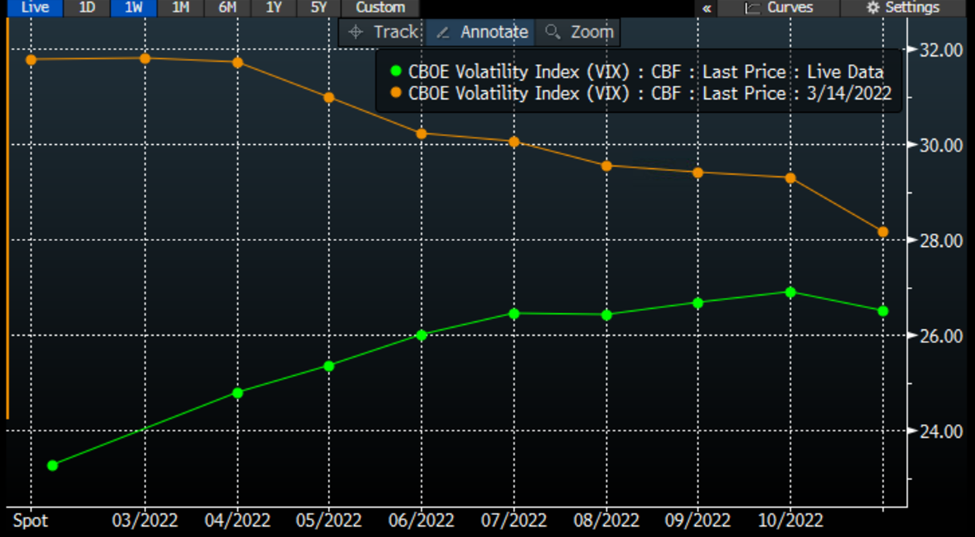
Source: Bloomberg
The week’s move was notable not only because spot VIX fell over 8 points in just a week[i] to a reading in the low 20’s, but the curve quickly shifted from nervous-seeming backwardation to complacent-seeming contango in that timeframe. It is too early to call the sentiment truly complacent – that would usually require a spot VIX in the teens – but it is clear that volatility assumptions became much tamer over the remainder of the tradeable year. Bear in mind that the Fed has neither said that they will remain limited to 25 basis points (bp) for subsequent meetings nor given any clarity about when they intend to begin reducing its balance sheet. Apparently the fact they declined to take more aggressive action now was sufficient to mollify traders’ views of both present and future volatility. (Oh, by the way, there is a mid-term election in November.)
That seems like we got the all-clear, right? Not so fast. Stock traders’ gloomier cousins in the bond markets are far less sanguine. The prices of 2-Year and 10-Year note futures fell steadily over that same period:
6 Day Chart, 5 Minute Bars, March 14-21st, 2-Year Futures (red/green), 10-Year Futures (blue)
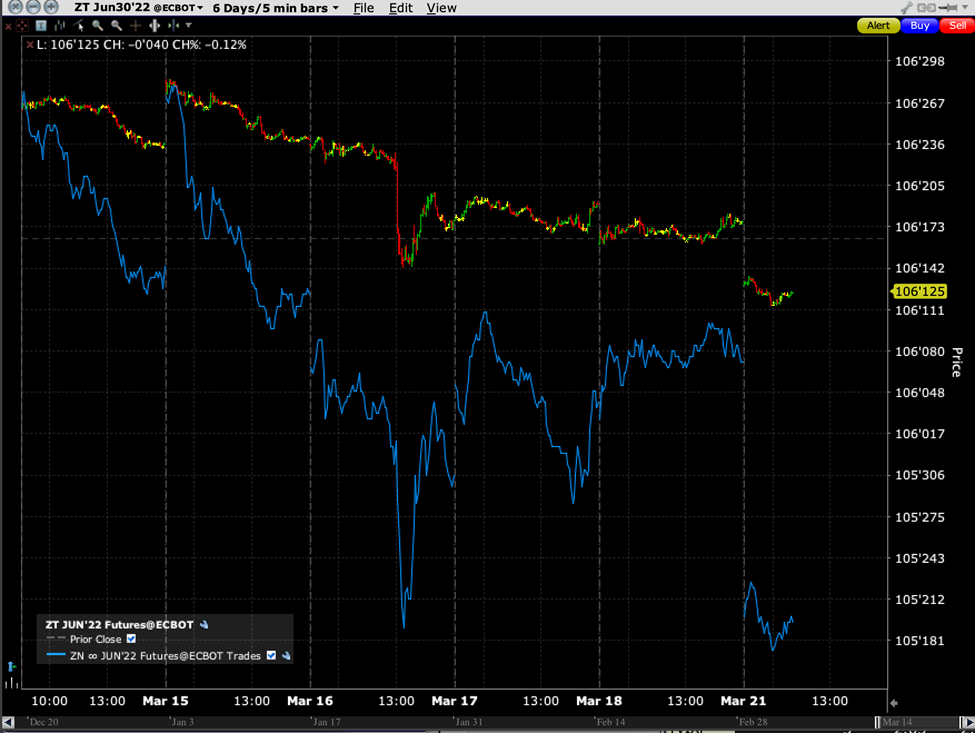
Source: Interactive Brokers
While it is certainly the case that the 10-Year futures fell far more than the 2-Years, that is a function of their longer duration. Bonds with longer durations move more than those with shorter durations, even if the moves in yields are relatively similar. We see that in the following graph of changes in the Treasury yield curve:
US Treasury Active Yield Curve, 2-30 Year Tenors, Current (green) vs. One Week Ago (orange)
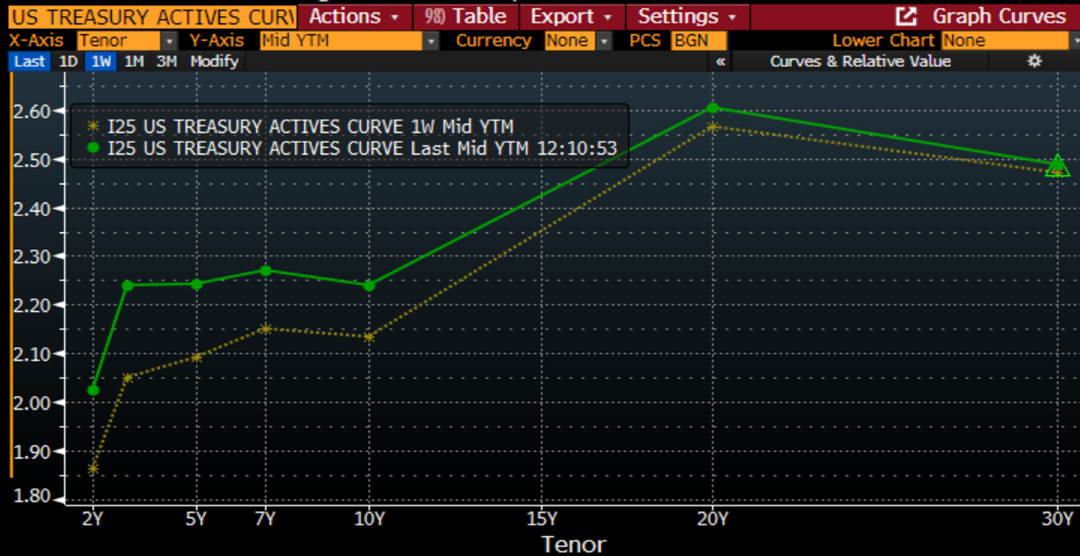
Source: Bloomberg
Over the course of the week we saw 2-Year rates rise by about 16bp, and 10-Year rates rise by about 11bp. That means that the 2-10 spread, which is important for bank profitability, contracted by 5 bp to a skimpy 22 bp spread. More important, note the little humps between 3- and 5-Year, and between 7- and 10-Year yields. Those are inversions. Minor and nearly imperceptible inversions, to be sure, but bond traders are always on the alert for those types of signals. Inverted yield curves can imply recession risk. The full curve is far from inverted, but the trend seems to be moving in that direction. Note the overall rise in rates and the flattening yield curve that we have seen over the past three months:
US Treasury Active Yield Curve, 2-30 Year Tenors, Current (green dots and triangles) vs. One Week Ago (orange dots and stars), One Month Ago (green dashes and square), Three Months Ago (orange dashes and circles)
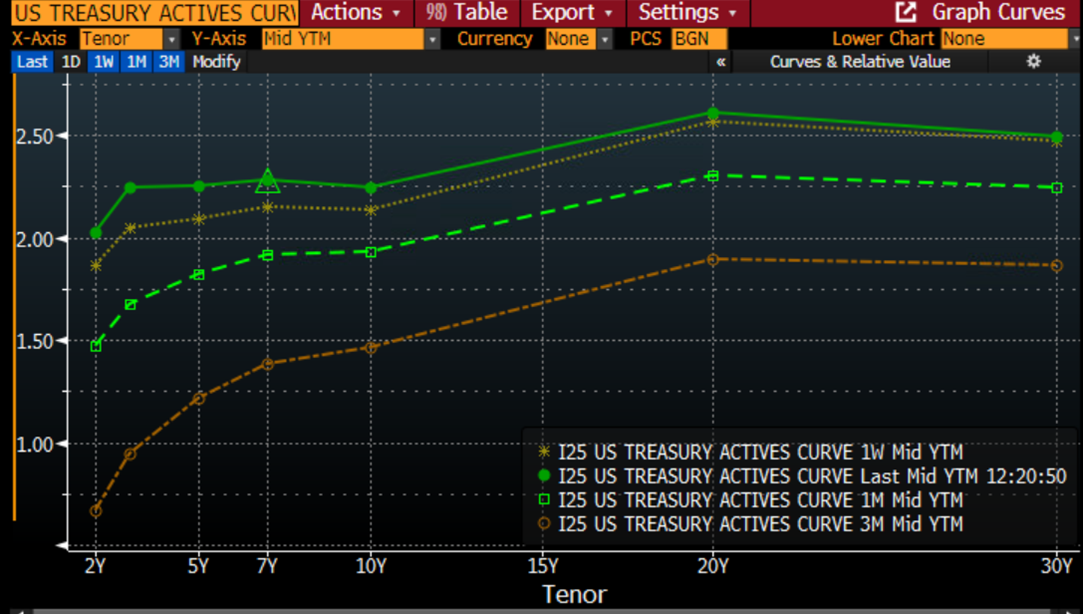
Source: Bloomberg
Bullish investors would love to view last week’s equity rally as a key turning point after nearly three months of declines. It’s not clear that bond markets agree. Time will tell whether we saw the start of a new bull market or yet another in a series of “buy-the-dip, sell-the-rip” events that we’ve seen this year.
—
[i] Yes, it’s about 25%, but VIX is one of the few indices where I think that expressing moves in percentage changes can be misleading
Disclosure: Interactive Brokers
The analysis in this material is provided for information only and is not and should not be construed as an offer to sell or the solicitation of an offer to buy any security. To the extent that this material discusses general market activity, industry or sector trends or other broad-based economic or political conditions, it should not be construed as research or investment advice. To the extent that it includes references to specific securities, commodities, currencies, or other instruments, those references do not constitute a recommendation by IBKR to buy, sell or hold such investments. This material does not and is not intended to take into account the particular financial conditions, investment objectives or requirements of individual customers. Before acting on this material, you should consider whether it is suitable for your particular circumstances and, as necessary, seek professional advice.
The views and opinions expressed herein are those of the author and do not necessarily reflect the views of Interactive Brokers, its affiliates, or its employees.
")
