


I’ve been trying to think of the proper mental image for a VIX that seems to steadily ratchet down to ever-lower handles. For the second time this month, the best I could come up with is a line dance – this time it’s the limbo. Can we get below 17? No problem. How about 16, 15, 14? So far, so good. How low can we go?
This is hardly a new topic for us. Faithful readers know that volatility is a frequent theme in our daily pieces, and the fact that we have been plumbing multi-year lows in VIX on a relatively consistent basis has hardly escaped our attention. We wrote at length about it from mid-April through early May, just before a brief spike from 15.50 to 21.50 in the four days that included the last FOMC meeting. On April 28th, we noted:
The rally of the past two days has caused VIX to sink to its lowest levels since November 2021. We even saw a 15 handle briefly today. For perspective, November 2021 was the peak in NDX, about 27% above current levels. (SPX peaked in early January 2022).
Can this relative complacency continue? If past is prologue, then sure. We’ve been in a tight range and it’s normal for people to have a recency bias. That means that recent events weigh more heavily in people’s decision making. We’ve been quiet, so it’s normal for traders to extrapolate that calm into their pricing.
Might the coming week’s FOMC meeting and/or Apple (AAPL) earnings upset that calm? Sure…
It turned out that there was some degree of truth in both assertions. On balance, we have indeed seen the relative complacency continue. And as it turned out, the FOMC meeting (though not AAPL), did turn out to be the catalyst for the aforementioned spike. But complacency remains in the fore.
In our mid-April piece, we asserted that VIX often functions better as a contrarian than a predictive indicator. In theory, it is meant to tell us the market’s best expectation for volatility over the coming 30 days. As the Cboe describes it:
The VIX Index is a calculation designed to produce a measure of constant, 30-day expected volatility of the U.S. stock market, derived from real-time, mid-quote prices of S&P 500® Index (SPX℠) call and put options.
Yet in practice, it tends to follow changes in SPX rather closely. The chart below updates one that we first used in mid-April, showing the level of VIX versus the rolling 1-month percentage changes in SPX. Quite frankly, it is as reactive as it is predictive, if not more.
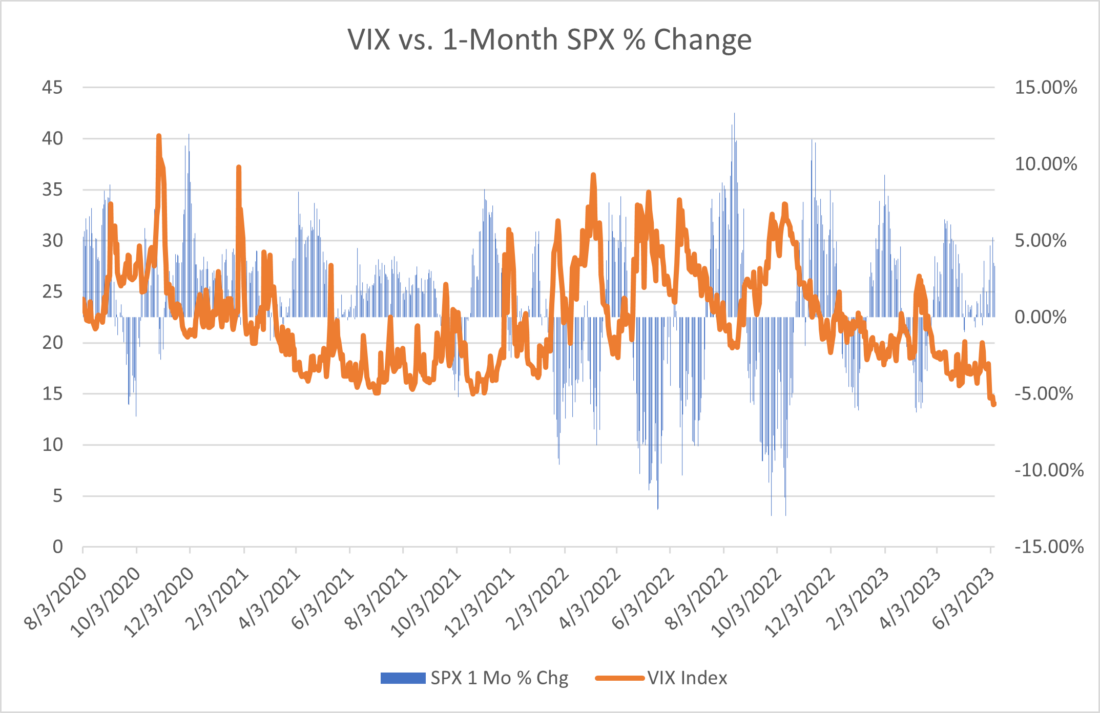
Source: Interactive Brokers
Recency bias is a well-known concept in behavioral finance. Originating in psychology, it is the phenomenon that people tend to favor recent events over those that occurred some time ago. It would not at all be surprising that traders, who often use the past as prologue, favor more recent events over those that occurred some time ago. If we’re headed down, then traders assume that might persist; and vice versa.
But that only covers part of the decision process. I believe that demand for VIX and volatility protection in general is a reaction to fear and greed – particularly by institutional investors. Although individuals and aggressive institutions have favored zero-dated options for their speculative and hedging strategies, larger institutions continue to favor the highly evolved and liquid VIX complex. It is a more efficient way to hedge significant portfolios, which is the basis of our assertion that 0DTE options have not “broken” VIX.
When institutions get nervous, they seek protection in VIX. When they feel sanguine, they don’t. Large institutions obviously either feel sanguine or that they have already de-risked their portfolios sufficiently by raising cash, investing defensively, or similar. If the former is the case, then VIX can spike in a hurry. We saw it in early May, and at several other times in the chart above. The spikes occur when portfolio managers and/or large traders clamor for protection simultaneously and in a hurry. And the more sanguine they are, the more susceptible they are to a change in sentiment.
Bear in mind the timing of the piece we wrote in early May. An FOMC meeting was occurring within a few days, and the market was caught by surprise. We have another meeting one week from today. As we noted, a “skip” is widely expected. The current probability is 33% for a 25-basis point hike. There is varying views about whether that “skip” will lead to a pause in rate hikes, and maybe a pivot to lower rates eventually.
We seem awfully sanguine about a benign outcome to a meeting with a wide range of potential outcomes, don’t we?
Join The Conversation
If you have a general question, it may already be covered in our FAQs. If you have an account-specific question or concern, please reach out to Client Services.
Leave a Reply
Disclosure: Interactive Brokers
The analysis in this material is provided for information only and is not and should not be construed as an offer to sell or the solicitation of an offer to buy any security. To the extent that this material discusses general market activity, industry or sector trends or other broad-based economic or political conditions, it should not be construed as research or investment advice. To the extent that it includes references to specific securities, commodities, currencies, or other instruments, those references do not constitute a recommendation by IBKR to buy, sell or hold such investments. This material does not and is not intended to take into account the particular financial conditions, investment objectives or requirements of individual customers. Before acting on this material, you should consider whether it is suitable for your particular circumstances and, as necessary, seek professional advice.
The views and opinions expressed herein are those of the author and do not necessarily reflect the views of Interactive Brokers, its affiliates, or its employees.
Disclosure: Options Trading
Options involve risk and are not suitable for all investors. Multiple leg strategies, including spreads, will incur multiple commission charges. For more information read the "Characteristics and Risks of Standardized Options" also known as the options disclosure document (ODD) or visit ibkr.com/occ


Cogent. But let’s note that algorithms don’t experience fear.
Thank you for sharing, T.
Great color. Thanks
Thanks for the compliment, John! We hope you’ll continue to follow Traders’ Insight.