


")


Bond prices are sharply higher today, meaning that yields are dropping across the curve. Lower rates are providing a lift to equities, with tech stocks leading the way. (We have discussed the rather convenient relationship between tech stocks and yields here.) Yields in the 1- to 30-year range are all down by 10-13 basis points, which is quite substantial. The chart below shows the moves, which result in a roughly parallel downward shift in the curve:
US Treasury Actives Yield Curves, June 23rd (green, top) vs. June 22nd (yellow, top); Change in Rates (Bottom)
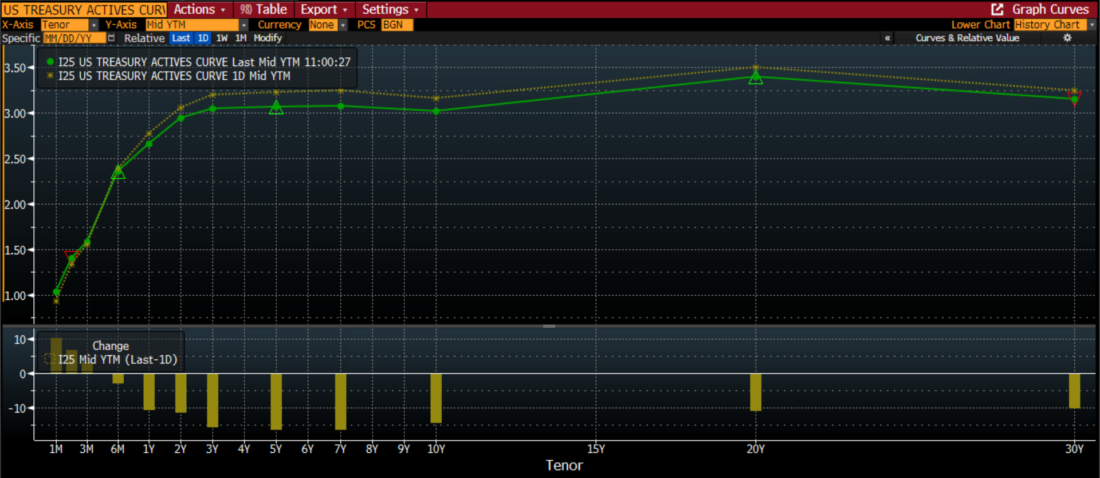
Source: Bloomberg
There appears to be a narrative that rates are lower because of rising recession fears. Consider me skeptical about that. Stocks shouldn’t be performing well if recession fears are rising. Recessions dampen earnings, which obviously hamper stock valuations. So let’s try something else, shall we?
One sign of true recession fears is an inversion in the yield curve, when short-term rates exceed their longer-term counterparts. If you squint really hard at the chart above you can see that 10-year yields are slightly below those in the 3-7 year range. Technically that is an inversion. But ask yourself if it’s more likely that the slight dip in 10-year yields is more likely the result of technical factors rather than a sober prediction about a recession occurring sometime around the end of decade.
It is far more likely that bonds are simply recovering from a highly oversold condition, just like stocks. The graph below contains all the data from the prior one, but it adds a snapshot of the yield curve from one month ago:
US Treasury Actives Yield Curves, June 23rd (solid green, top) vs. June 22nd (yellow, top) and May 23rd (dashed green, top); Change in Rates, 1 Day (yellow, bottom), 1 Month (green, bottom)
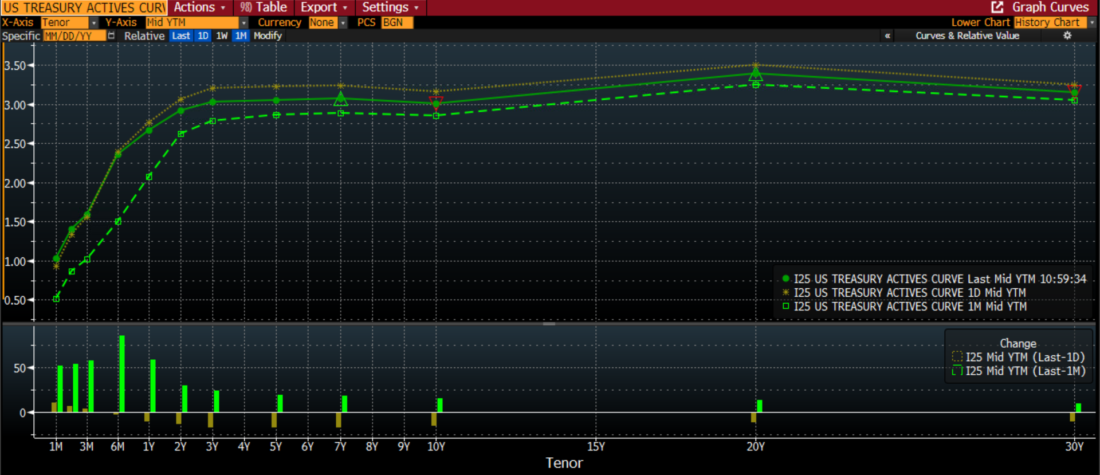
Source: Bloomberg
Today’s move is recouping some of the move that we have seen over the past month. The move in the front end of the curve is dramatic and persistent – the direct result of the Fed’s hike last week. But the rest of the curve is simply recouping much of the recent drop in bond prices. Stock traders have been net buyers after the recent declines. It makes perfect sense for bond traders to be doing the same.
Actually, I believe that the most important inversion is not being shown on the chart. As we alluded to above, the result of last week’s FOMC meeting was a 75 basis point hike in the Fed Funds rate target to 1.50-1.75%. It is important to remember that the Fed Funds rate is an average overnight transactions. It doesn’t show up on the Treasury yield curve. If it did, it would be obvious that the Fed Funds rate exceeds the rate on T-notes with 3-month and shorter maturities.
This inversion again is more likely the result of technical factors than the fear that we will have a recession that will be resolved in less than a year (though it is entirely possible that we’re already in a recession and don’t know it yet). This is yet another demonstration that the system is awash in cash that needs to find a home.
We recently wrote about the record and rising levels of reverse repo activity at the New York Fed. We noted that some of the new cash was the result of investors selling assets, while much of the existing cash resulted from the monetary stimuli that had been in place for the past two years. Since we wrote the article about two weeks ago, the activity remains robust, and a new record was set yesterday, with over $2.2 trillion seeking the 1.55% offered by the Fed. Lower stock and bond markets mean that someone was raising cash, and it had to go somewhere.
The Fed window can only be accessed by a select group of counterparties – essentially large banks. The rest of us don’t have that opportunity, and if we want to acquire short-term, risk-free assets we need to accept rates that are well below the Fed Funds target. I haven’t heard a member of Congress question Chairman Powell about this, but that would be my first question to him. But in the short term, it means that there is an awful lot of cash sloshing around until or unless the Fed takes further actions to mop it up.
I’ll let my conclusion from the prior article stand. It still applies, and explains why we may continue to see pockets of enthusiasm in otherwise rocky stock and bond markets:
The bad news is this: the Fed will need to be relentless if it is serious about reducing the amount of excess liquidity in the system. The good news is this: it is not at all clear that the Fed is currently willing to undertake those measures; until they do, this could provide a source of support for risk assets when they come under pressure. There appears to be plenty of cash on the sidelines – it depends upon investors’ willingness to deploy it.
Disclosure: Interactive Brokers
The analysis in this material is provided for information only and is not and should not be construed as an offer to sell or the solicitation of an offer to buy any security. To the extent that this material discusses general market activity, industry or sector trends or other broad-based economic or political conditions, it should not be construed as research or investment advice. To the extent that it includes references to specific securities, commodities, currencies, or other instruments, those references do not constitute a recommendation by IBKR to buy, sell or hold such investments. This material does not and is not intended to take into account the particular financial conditions, investment objectives or requirements of individual customers. Before acting on this material, you should consider whether it is suitable for your particular circumstances and, as necessary, seek professional advice.
The views and opinions expressed herein are those of the author and do not necessarily reflect the views of Interactive Brokers, its affiliates, or its employees.


