


GOOG Earnings Moves: Historical Patterns
Investing in the stock market can be both thrilling and challenging, especially during earnings season. Google (GOOG) recently reported its earnings, and the stock experienced a noteworthy gain of +5.6% on the day. Delving into the historical data, we can uncover valuable patterns that shed light on GOOG’s trading behavior around earnings events. Let’s explore the fascinating trends and tendencies that could help guide your decisions.
Gapping Up and Drifting Lower
GOOG Historical Stock Price Moves Around Earnings
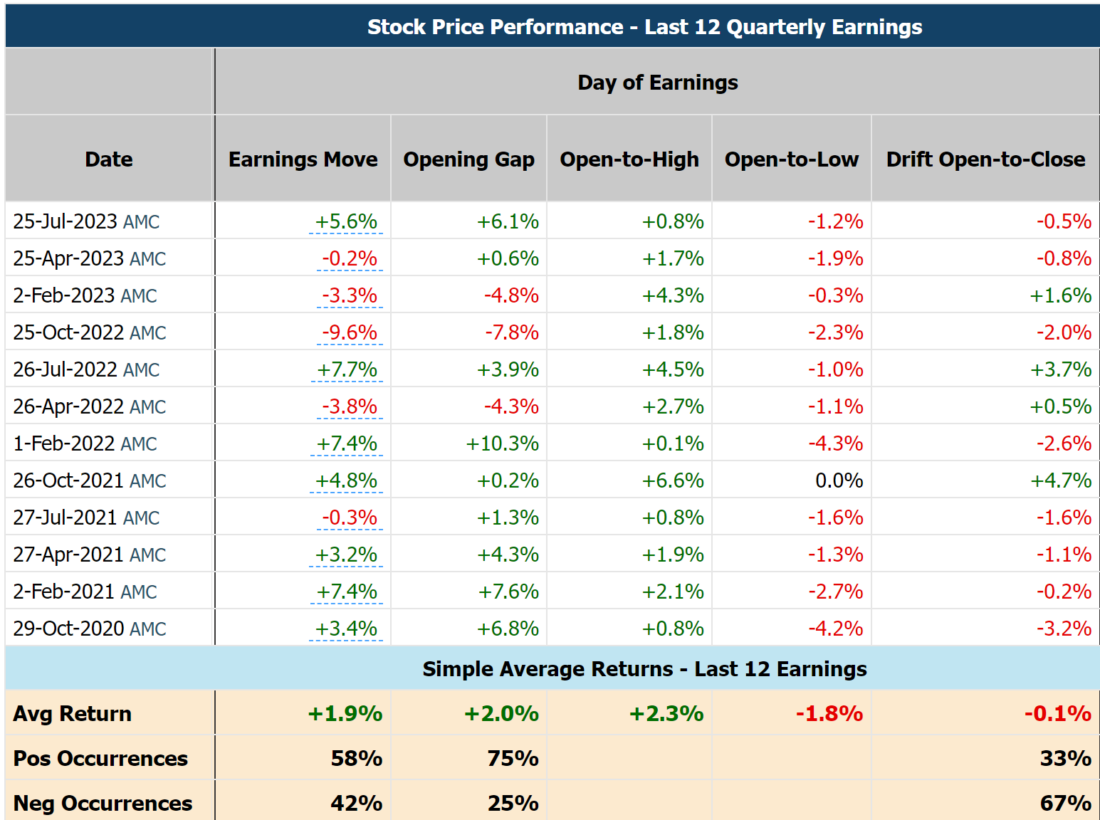
One remarkable characteristic of GOOG’s historical earnings move is its tendency to gap higher at the open, occurring in 75% of the last 12 quarters. This initial surge often captures the market’s positive sentiment following the earnings announcement. However, as the day progresses, the stock tends to drift lower from the open price about 67% of the time. This pattern suggests that some investors might be taking profits after the initial excitement, creating potential opportunities for others to enter the market at a more favorable price.
Profitable Pre-Earnings Run-Up
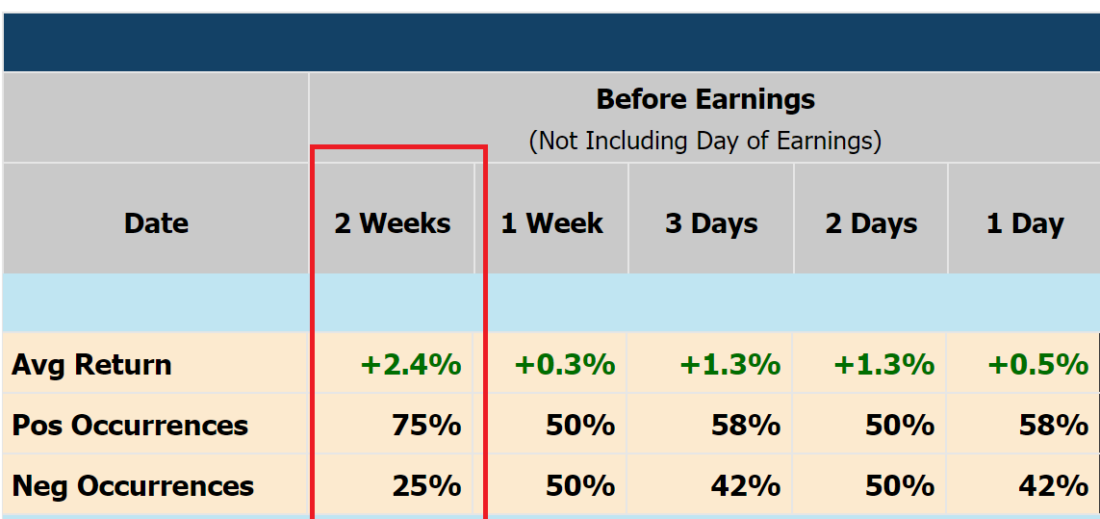
What’s even more intriguing is GOOG’s behavior in the two weeks leading up to its earnings release. About 75% of the time, the stock experienced a run-up, with an average gain of 2.4%. This period has proven to be the most profitable window to hold GOOG around the earnings event. Investors looking to capitalize on price momentum might find this pre-earnings run-up as an attractive opportunity.
Post-Earnings Momentum
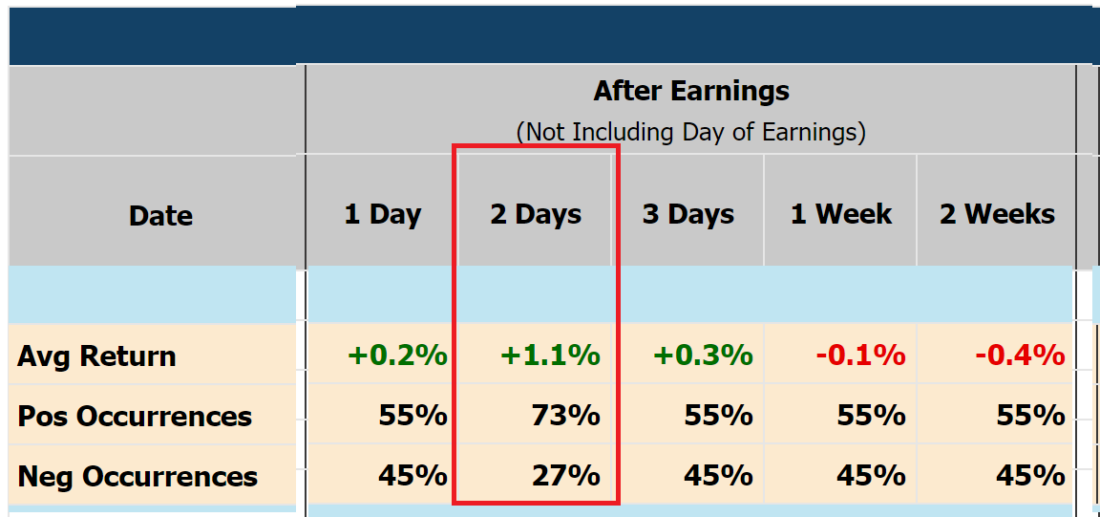
After the earnings release, GOOG showed a strong performance over the next two days, with the stock increasing in share price about 73% of the time. This post-earnings momentum could be enticing for short-term traders looking to take advantage of immediate price reactions.
Volatility for Option Traders
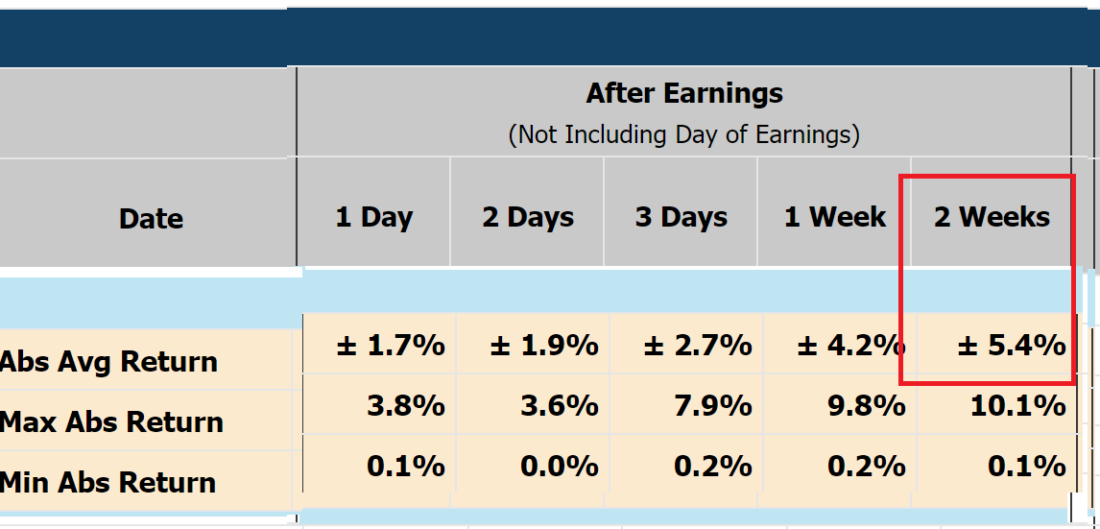
For option traders who thrive on volatility, GOOG’s earnings history offers an interesting prospect. Over the two weeks following the earnings release, the stock tended to fluctuate on average +/- 5.4%. This indicates potential opportunities for option strategies that benefit from price swings, as the stock exhibited considerable movements during this period.
Historical Range for Reference
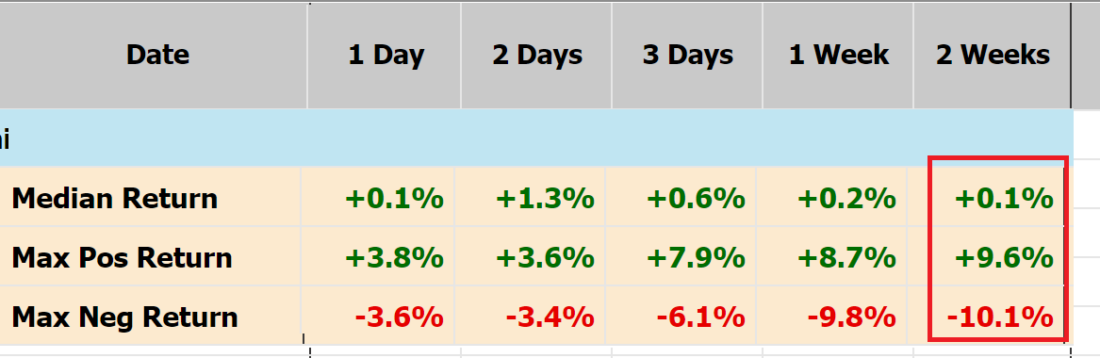
While past performance is not indicative of future results, analyzing the historical return distribution can provide valuable insights for investors. GOOG’s maximum down move exceeded the maximum up move, with -10.1% compared to +9.6%. This historical range can serve as a reference point for assessing potential downside risk and upside potential.
—
Originally Posted July 26, 2023 – Did GOOG Price Action Follow Its Historical Pattern After Earnings?
Disclaimer
As with any investment, uncertainty remains a constant factor in the stock market. While we cannot know future market movements with absolute certainty, understanding GOOG’s historical earnings moves can equip investors with valuable guidance.
Always exercise caution and conduct further research before making any investment decisions. Armed with these insights, investors can navigate the market with more informed choices and potentially seize opportunities around GOOG’s earnings events.
Disclosure: Market Chameleon
The information provided on MarketChameleon is for educational and informational purposes only. It should not be considered as financial or investment advice. Trading and investing in financial markets involve risks, and individuals should carefully consider their own financial situation and consult with a professional advisor before making any investment decisions. MarketChameleon does not guarantee the accuracy, completeness, or reliability of the information provided, and users acknowledge that any reliance on such information is at their own risk. MarketChameleon is not responsible for any losses or damages resulting from the use of the platform or the information provided therein. The 7-day free trial is offered for evaluation purposes only, and users are under no obligation to continue using the service after the trial period.
Disclosure: Interactive Brokers
Information posted on IBKR Campus that is provided by third-parties does NOT constitute a recommendation that you should contract for the services of that third party. Third-party participants who contribute to IBKR Campus are independent of Interactive Brokers and Interactive Brokers does not make any representations or warranties concerning the services offered, their past or future performance, or the accuracy of the information provided by the third party. Past performance is no guarantee of future results.
This material is from Market Chameleon and is being posted with its permission. The views expressed in this material are solely those of the author and/or Market Chameleon and Interactive Brokers is not endorsing or recommending any investment or trading discussed in the material. This material is not and should not be construed as an offer to buy or sell any security. It should not be construed as research or investment advice or a recommendation to buy, sell or hold any security or commodity. This material does not and is not intended to take into account the particular financial conditions, investment objectives or requirements of individual customers. Before acting on this material, you should consider whether it is suitable for your particular circumstances and, as necessary, seek professional advice.
Disclosure: Options Trading
Options involve risk and are not suitable for all investors. Multiple leg strategies, including spreads, will incur multiple commission charges. For more information read the "Characteristics and Risks of Standardized Options" also known as the options disclosure document (ODD) or visit ibkr.com/occ


Join The Conversation
If you have a general question, it may already be covered in our FAQs. If you have an account-specific question or concern, please reach out to Client Services.