


We Break Down INTC’s Option Order Flow
With INTC’s options trading volume exceeding it’s daily average by 190%, you might be asking:
Are these trades predominantly bullish or bearish?
Is the trend leaning towards buying or selling options?
And, which specific options are traders focusing on?
To answer these, a thorough analysis of each trade is needed. MarketChameleon’s Option Order Flow Sentiment tool simplifies this by breaking down trades into delta volume and providing detailed analytics, enabling an in-depth examination of the order flow in INTC’s options.
Marketchameleon’s algorithm produced the following Option Order Flow Sentiment report for INTC.
Let’s examine its key sections to address some fundamental questions.
Is The Options Order Flow In INTC More Bullish or Bearish On-Balance?
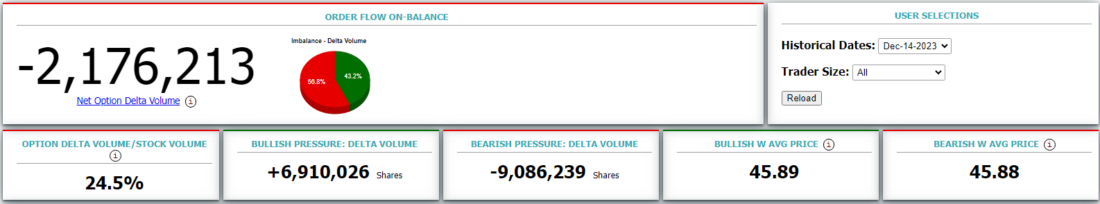
The first metric, estimated a negative delta imbalance of -2.1 million, suggests more sell than buy pressure from options.
How Significant is Today’s Option Activity Relative to INTC’s Stock Volume?
This measures how large of a role do options traders play in INTC. We compare the total delta volume of options trades to INTC’s stock volume.
As you can see, that options delta volume represents a substantial 24.5% of the stock volume, underscoring the considerable influence of options traders on INTC’s market activity.
How Does The Bullish Pressure Compare To Bearish Option Pressure?
We also want to compare the bullish and bearish pressure separately to understand if there was trading both ways or an outsized skew in one direction.
Analyzing the incoming options flow, the system indicates 6.9 million bullish delta volume and -9 million bearish delta volume. While there is more bearish delta on balance, this implies that there is a good amount of order flow trading from both sides.
Where Was The Stock Price When These Options Traded?
Another key metric is to track the stock reference price at the time of the options trades. We use this to determine the price level at which these trades predominantly occurred.
Bullish trades had a weighted average reference price of $45.89, while bearish delta trades averaged $45.88. This close range indicates a tight competition between option delta buyers and sellers, suggesting that the trades weren’t heavily influenced by major fluctuations in the stock price.
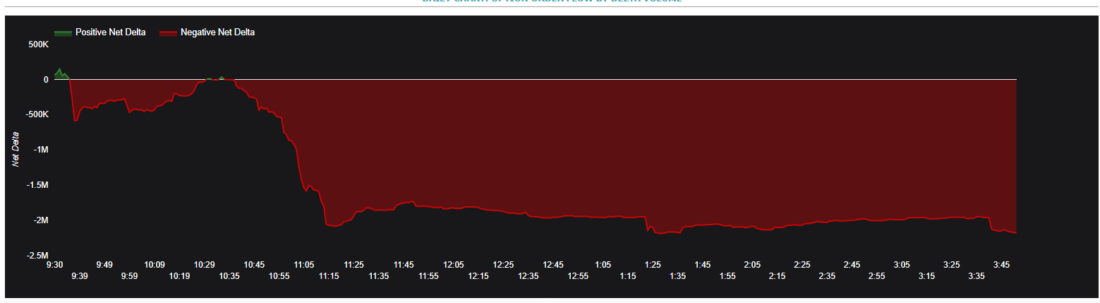
How Did The Delta Volume Change Over The Day?
Source: Marketchameleon
The cumulative delta chart further illuminates the dynamic of the day’s trading activity. A surge in bearish delta occurred around 10:30, continuing until 11:15 AM Eastern before leveling off. This suggests a concentrated period of increased bearish sentiment followed by a stabilization.
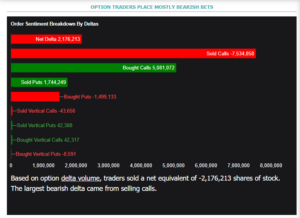
Is There More Buying Or Selling Of Options?

Source: Marketchameleon
Another metric we want to check is how these option delta trades were initiated. Options can be bought or sold. This can add color to determine if traders intent may be trading the options for volatility and time decay.
A breakdown shows a preference for selling options – more deltas originate from call selling over buying and put selling surpasses put buying. This indicates that traders are favoring option selling strategies in the current markets.
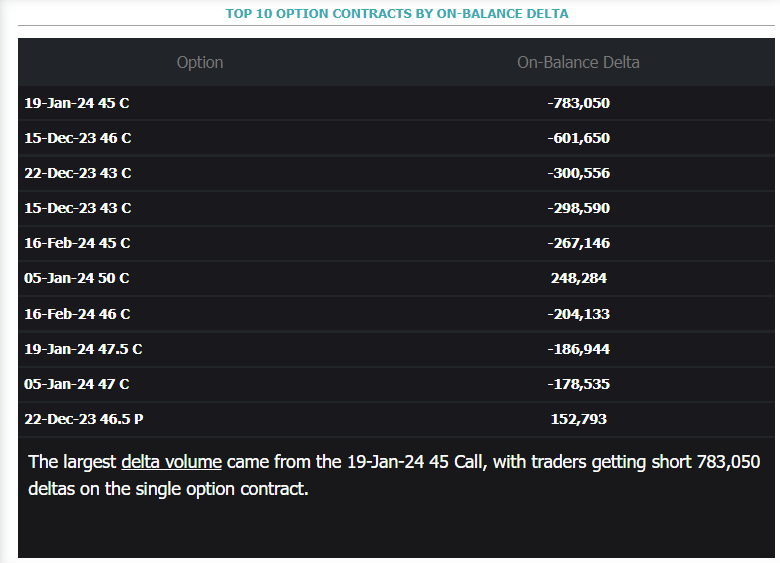
Which Contracts Show the Largest Delta Volume?
Source: Marketchameleon
The table highlights the top 10 options contracts influencing delta volume.
Notably, dominant call contracts are mostly selling deltas, suggesting higher call selling activity. This trend might reflect traders locking in profits, selling for premium, or managing risk against long positions for income generation.
It implies that bearish delta trends could stem more from volatility and decay-driven options selling, rather than aggressive bearish positions like excessive put buying.
In conclusion, analyzing options volume through delta provides valuable insights into INTC’s options activity relative to overall stock volume and potential hedging pressure.
The observed negative delta imbalance in INTC, particularly from 10:30 to 11:15 AM Eastern, indicates a potential inclination towards selling pressure, primarily driven by call option sellers.
Note: The order flow analysis utilizes an algorithm to generate estimates based on observed data and trade tape information. It’s important to note that there’s no definitive way to determine each trader’s actual intent. The analysis essentially interprets the data available, offering insights but not absolute conclusions about trader behaviors.
—
Originally Posted December 14, 2023 – INTC Options Volume Trades 2.9 X Average: We Break Down The Order Flow
NOTE: Stock and option trading involves risk that may not be suitable for all investors. Examples contained within this report are simulated And may have limitations. Average returns and occurrences are calculated from snapshots of market mid-point prices And were Not actually executed, so they do not reflect actual trades, fees, or execution costs. This report is for informational purposes only, and is not intended to be a recommendation to buy or sell any security. Neither Market Chameleon nor any other party makes warranties regarding results from its usage. Past performance does not guarantee future results. Please consult a financial advisor before executing any trades. You can read more about option risks and characteristics at theocc.com.
The information is provided for informational purposes only and should not be construed as investment advice. All stock price information is provided and transmitted as received from independent third-party data sources. The Information should only be used as a starting point for doing additional independent research in order to allow you to form your own opinion regarding investments and trading strategies. The Company does not guarantee the accuracy, completeness or timeliness of the Information.
Disclosure: Market Chameleon
The information provided on MarketChameleon is for educational and informational purposes only. It should not be considered as financial or investment advice. Trading and investing in financial markets involve risks, and individuals should carefully consider their own financial situation and consult with a professional advisor before making any investment decisions. MarketChameleon does not guarantee the accuracy, completeness, or reliability of the information provided, and users acknowledge that any reliance on such information is at their own risk. MarketChameleon is not responsible for any losses or damages resulting from the use of the platform or the information provided therein. The 7-day free trial is offered for evaluation purposes only, and users are under no obligation to continue using the service after the trial period.
Disclosure: Interactive Brokers
Information posted on IBKR Campus that is provided by third-parties does NOT constitute a recommendation that you should contract for the services of that third party. Third-party participants who contribute to IBKR Campus are independent of Interactive Brokers and Interactive Brokers does not make any representations or warranties concerning the services offered, their past or future performance, or the accuracy of the information provided by the third party. Past performance is no guarantee of future results.
This material is from Market Chameleon and is being posted with its permission. The views expressed in this material are solely those of the author and/or Market Chameleon and Interactive Brokers is not endorsing or recommending any investment or trading discussed in the material. This material is not and should not be construed as an offer to buy or sell any security. It should not be construed as research or investment advice or a recommendation to buy, sell or hold any security or commodity. This material does not and is not intended to take into account the particular financial conditions, investment objectives or requirements of individual customers. Before acting on this material, you should consider whether it is suitable for your particular circumstances and, as necessary, seek professional advice.
Disclosure: Options Trading
Options involve risk and are not suitable for all investors. Multiple leg strategies, including spreads, will incur multiple commission charges. For more information read the "Characteristics and Risks of Standardized Options" also known as the options disclosure document (ODD) or visit ibkr.com/occ
Disclosure: Options (with multiple legs)
Options involve risk and are not suitable for all investors. For information on the uses and risks of options, you can obtain a copy of the Options Clearing Corporation risk disclosure document titled Characteristics and Risks of Standardized Options by clicking the link below. Multiple leg strategies, including spreads, will incur multiple transaction costs. "Characteristics and Risks of Standardized Options"


Join The Conversation
If you have a general question, it may already be covered in our FAQs. If you have an account-specific question or concern, please reach out to Client Services.