


NVDA Options Skew Hints at Bullish Bets on AI Leader
As NVIDIA (NVDA) continues to soar on artificial intelligence (AI) enthusiasm, a closer look at its options market reveals interesting insights into how traders are positioning themselves. This article explores the current positive skew in NVDA options, historical comparisons, preferred call strikes, and what it all means for traders outlook of the stock.
Positive Skew In NVDA Options Graph
Options Implied Volatility Skew In NVDA
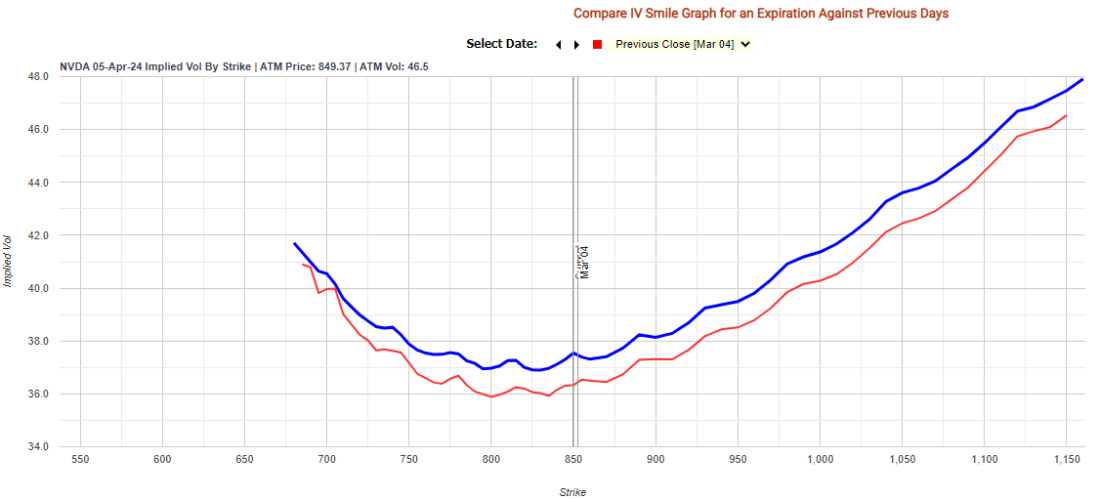
The current positive skew in NVDA options indicates a preference for bullish call options relative to bearish put options. This means traders are generally more willing to pay for calls that will become profitable if the stock price increases.
This skew suggests that many expect NVDA to continue its upward climb and are using out-of-the-money (OTM) calls to potentially amplify their gains from such a move.
The above graph shows a steeper implied volatility (IV) curve for upside calls compared to downside puts. This steeper slope reflects a higher premium for calls, further emphasizing the bullish sentiment.
Skew Compared to History
Historical Risk Reversal Benchmark In NVDA
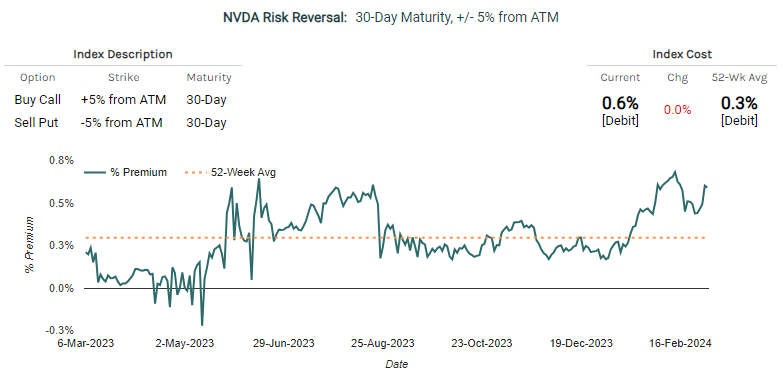
While the current positive skew is a sign of optimism, it’s important to compare it to historical levels. The above chart shows a historical benchmark risk/reversal strategy that compares the cost of +5% calls versus -5% puts.
As you can see, the cost of a call over a put is currently near the higher range of the past year suggesting a significant bullish bias. However, it’s important to note that this level has been reached a few times this year already, potentially reflecting the market’s excitement about NVDA’s future.
Open Interest Preferred Call Strikes
NVDA Open Interest By Strike Chart
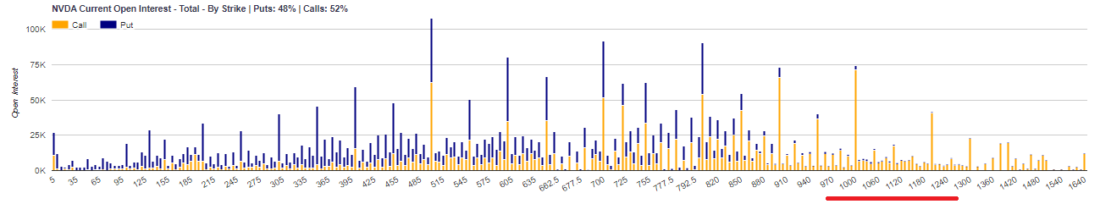
Analyzing the open interest by strike price paints another part of the picture. The concentration of open interest above 870, with the highest concentration around the 1000 strike, indicates that many call options are positioned for further gains.
This suggests traders believe the stock price could climb another 15% to reach the 1000 strike and potentially become in-the-money.
Conclusion
In conclusion, the current options market paints a picture of optimism surrounding NVDA.
The positive skew, high risk/reversal cost, and concentration of call options at higher strike prices all suggest that traders are largely betting on further gains for the stock. With the 1000 strike emerging as a potential near-term target, investors should closely monitor developments in the AI sector and the broader market to assess the validity of these bullish bets.
—
Originally Posted March 4, 2024 – Options Skew in NVDA Near 52 Week High
NOTE: Stock and option trading involves risk that may not be suitable for all investors. Examples contained within this report are simulated And may have limitations. Average returns and occurrences are calculated from snapshots of market mid-point prices And were Not actually executed, so they do not reflect actual trades, fees, or execution costs. This report is for informational purposes only, and is not intended to be a recommendation to buy or sell any security. Neither Market Chameleon nor any other party makes warranties regarding results from its usage. Past performance does not guarantee future results. Please consult a financial advisor before executing any trades. You can read more about option risks and characteristics at theocc.com.
Disclosure: Market Chameleon
The information provided on MarketChameleon is for educational and informational purposes only. It should not be considered as financial or investment advice. Trading and investing in financial markets involve risks, and individuals should carefully consider their own financial situation and consult with a professional advisor before making any investment decisions. MarketChameleon does not guarantee the accuracy, completeness, or reliability of the information provided, and users acknowledge that any reliance on such information is at their own risk. MarketChameleon is not responsible for any losses or damages resulting from the use of the platform or the information provided therein. The 7-day free trial is offered for evaluation purposes only, and users are under no obligation to continue using the service after the trial period.
Disclosure: Interactive Brokers
Information posted on IBKR Campus that is provided by third-parties does NOT constitute a recommendation that you should contract for the services of that third party. Third-party participants who contribute to IBKR Campus are independent of Interactive Brokers and Interactive Brokers does not make any representations or warranties concerning the services offered, their past or future performance, or the accuracy of the information provided by the third party. Past performance is no guarantee of future results.
This material is from Market Chameleon and is being posted with its permission. The views expressed in this material are solely those of the author and/or Market Chameleon and Interactive Brokers is not endorsing or recommending any investment or trading discussed in the material. This material is not and should not be construed as an offer to buy or sell any security. It should not be construed as research or investment advice or a recommendation to buy, sell or hold any security or commodity. This material does not and is not intended to take into account the particular financial conditions, investment objectives or requirements of individual customers. Before acting on this material, you should consider whether it is suitable for your particular circumstances and, as necessary, seek professional advice.
Disclosure: Options (with multiple legs)
Options involve risk and are not suitable for all investors. For information on the uses and risks of options, you can obtain a copy of the Options Clearing Corporation risk disclosure document titled Characteristics and Risks of Standardized Options by clicking the link below. Multiple leg strategies, including spreads, will incur multiple transaction costs. "Characteristics and Risks of Standardized Options"


Join The Conversation
If you have a general question, it may already be covered in our FAQs. If you have an account-specific question or concern, please reach out to Client Services.