


This morning I was asked whether I was concerned about the recent spike in the CBOE SKEW Index (SKEW). Quite frankly, I hadn’t noticed. I know that the index has its fans, but I don’t typically pay close attention to it. Yet the recent spike in SKEW has brought some attention to the product. Any index that is creating sequential new highs after being around for several years deserves some attention – especially when some believe that the index could indicate dips in the broader market.
SKEW Index (white), CBOE Volatility Index (VIX, magenta), S&P 500 Index (white); 10 Years Weekly
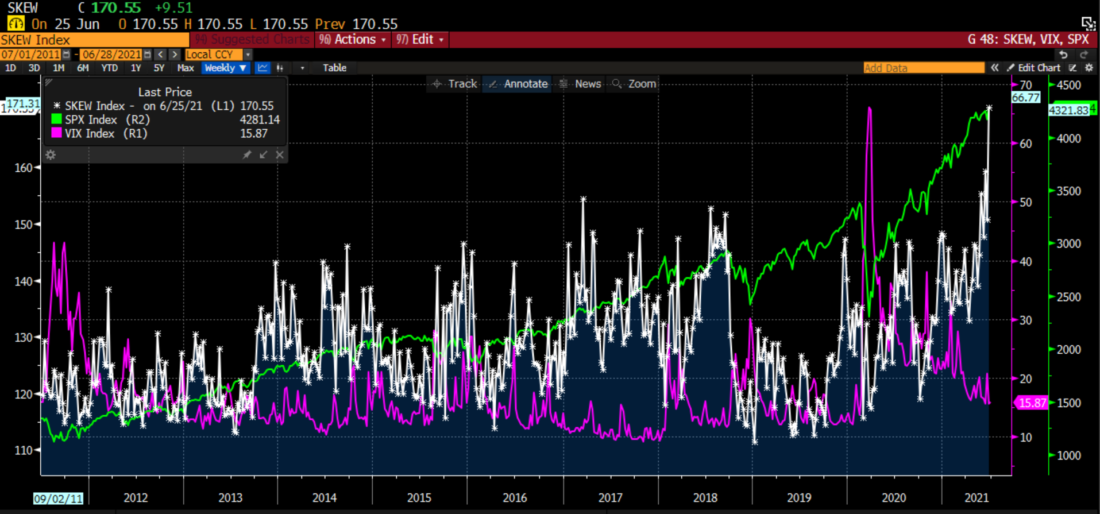
Source: Bloomberg
We see a sharp spike in SKEW over the past few weeks, with the index risking to an all-time high two weeks ago and continuing to rise ever since.
It is important to remember what SKEW measures. Options traders are familiar with a curve that looks like a smile when they graph the implied volatilities of options by moneyness (the percentage of a strike price to the current price of the underlying security). The graph below is fairly typical, showing the lowest implied volatility levels for at-money options and increasing asymmetrically as we move to strikes that are more out of the money. Below market options typically trade at higher implied volatility levels than their above market counterparts. That is because there is historically a greater demand for put protection than there is for call speculation, though that relationship has occasionally flipped during recent periods of high speculation. (We explain more about skew here and here.) We also see that skew on 1 month S&P 500 Index (SPX) options has been relatively consistent over the past 3 months:
SPX Skew, Implied Volatilities of 1 Month Options on June 28th, May 28th and March 26th, 2021 vs Moneyness

Source: Bloomberg
At this point, many of you may be questioning why the SKEW index has risen so sharply even though SPX options skew has increased only modestly. Much of that has to do with the way that SKEW is calculated. The calculation is detailed in this CBOE white paper. I will refrain from delving too deeply into the mathematics, but the denominator of the calculation is the standard deviation of SPX. If a numerator remains constant but the denominator falls, the result increases. The following graph shows the 20 day historical volatility of SPX, which is a reasonable proxy for standard deviation, alongside its implied volatility (remember that there are about 20 business days in a month):
SPX 20 Day Historical (orange) and Implied (blue) Volatilities

Source: Bloomberg
When we think about the SKEW index in those terms, we can now understand why the index is rising sharply. The relationship of below-market to at-money options has been relatively stable while overall volatility plunged.
None of this would matter if the SKEW Index simply moved in a vacuum. There are some who have noticed that bumps in SKEW have signaled dips in SPX. Consider the following graph:
SKEW Index (white), CBOE Volatility Index (VIX, magenta), S&P 500 Index (white); 3 Years Daily

Source: Bloomberg
We see that bumps in SKEW in the summer of 2018 and December of 2019 were followed about 2 months later by fairly significant dips in SPX. We also see that a bump last summer was followed by a modest decline before the broad indices resumed their advance. That would appear to make SKEW an enviable, early indicator of potential market declines. My problem with that approach is that SKEW has given plenty of false positives as well, which are evident in the graph directly above and the 10 year chart displayed earlier. It appears to be the case that most declines in SPX were preceded by bumps in SKEW, but not all bumps in SKEW were followed by declines in SPX.
The current rise in SKEW shows that hedgers are demanding protection even as SPX gets increasingly quiet. That could imply that traders view this as a calm before a storm that may be 4-8 weeks on the horizon. Or, they may just be nervously buying protection against an event that may never arise. We can certainly debate whether conditions are ripe for a selloff and whether hedgers’ fears are appropriate. The message from the SKEW index is potentially notable, but hardly conclusive.
Disclosure: Interactive Brokers
The analysis in this material is provided for information only and is not and should not be construed as an offer to sell or the solicitation of an offer to buy any security. To the extent that this material discusses general market activity, industry or sector trends or other broad-based economic or political conditions, it should not be construed as research or investment advice. To the extent that it includes references to specific securities, commodities, currencies, or other instruments, those references do not constitute a recommendation by IBKR to buy, sell or hold such investments. This material does not and is not intended to take into account the particular financial conditions, investment objectives or requirements of individual customers. Before acting on this material, you should consider whether it is suitable for your particular circumstances and, as necessary, seek professional advice.
The views and opinions expressed herein are those of the author and do not necessarily reflect the views of Interactive Brokers, its affiliates, or its employees.
Disclosure: Options Trading
Options involve risk and are not suitable for all investors. Multiple leg strategies, including spreads, will incur multiple commission charges. For more information read the "Characteristics and Risks of Standardized Options" also known as the options disclosure document (ODD) or visit ibkr.com/occ


