


As part of Nasdaq’s Index Options team, I focus on content. This includes information conveyed through a variety of mediums, but in my opinion, the best content is narrative-based. I believe humans use and connect with stories on a very basic level. It’s something that sets us apart from other forms of life. It’s part of what catapulted homo sapiens to the top of the food chain.
So, what’s the next chapter for emerging markets?
Emerging Markets
In truth, nobody knows, but there’s certainly opportunity and risk. Let’s understand what constitutes an “emerging market” (EM) and how these developing areas have performed historically through the lens of a few indexes. With some sense of where we came from, the jump to where we might go is far less foreboding.
An “emerging market” according to the International Monetary Fund (IMF), is characterized by “their high degree of volatility… with transitions occurring in economic, political, social and demographic dimensions.” These countries often exhibit some, but not all the traits associated with a developed economy.
In the visual above, the orange areas of the map illustrate the sizeable portion of the world considered “emerging” from an economic standpoint. The amber color indicates a “frontier” market which is less liquid and typically risker than an emerging nation.
EMs offer the potential for high return on investment because they can experience elevated growth rates relative to developed economies. EMs typically focus on export markets (commodities). As a result, they typically experience more cyclical growth as opposed to secular. They also tend to have lower per-capita incomes in part because of their dependence on international trade.
The most well-known EM economies include Brazil, Russia, India and China (BRICs). Following the global financial crisis (2007 – 2009), these countries helped stimulate growth as they expanded domestically and internationally.
Performance
There’s not a correct way to measure the performance of EMs. For example, what countries do you include? Which securities are weighted most heavily? When does a nation graduate to “developed” status?
There are a variety of indexes designed to track EM performance. For example, the NASDAQ Emerging Markets Index (NQEM) is a float adjusted market cap weighted index that includes securities in countries designated as EMs.
Another index dates back further and will be used to compare relative performance. Specifically, how and when EMs have under or outperformed compared to developed markets.
LONGTERMTRENDS & NASDAQ
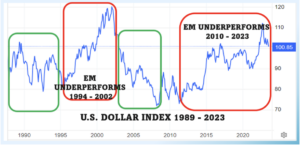
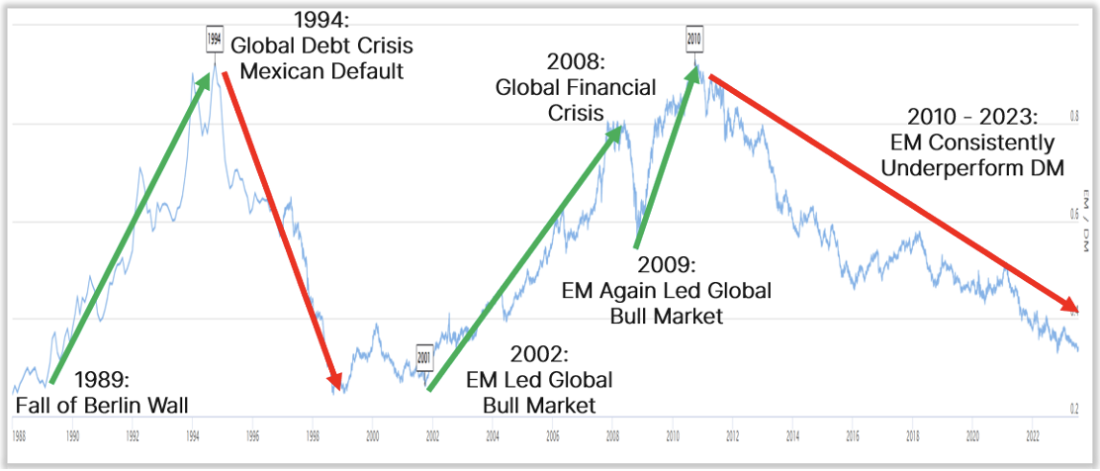
As the chart illustrates, there have been long periods of meaningful outperformance on the part of EMs ((1989 – 1994, 2002 – 2008, and 2009 – 2010). There have also been extended stretches where EMs dramatically underperformed compared to developed markets (DM).
Since 2010, the trend relative to DMs has been lower. There’s no single point of attribution. However, the post-2010 period has been defined by historically low interest rates globally. The relative cost of money has significant knock-on effects, including in the currency markets.
The U.S. Dollar (USD) has been a global reserve currency in the post-WWII era. In short, that means that most of the international trade is denominated in USD. When the U.S. Dollar is strong relative to foreign currencies, EMs tend to underperform.

TRADING ECONOMICS & NASDAQ
Countries & Constituents
The largest constituent holdings for the MSCI Emerging Markets Index are Taiwan Semiconductor, Tencent Holdings, Samsung and Alibaba. They make up slightly more than 17% of the overall index.
The leading firms represent Taiwan, China (Tencent and Alibaba) as well as South Korea. Asian-domiciled firms constitute about 77% of the index. Latin America makes up about 9%. Middle Eastern companies account for 7.2%. Africa follows at 3.18% with a small European contingent.
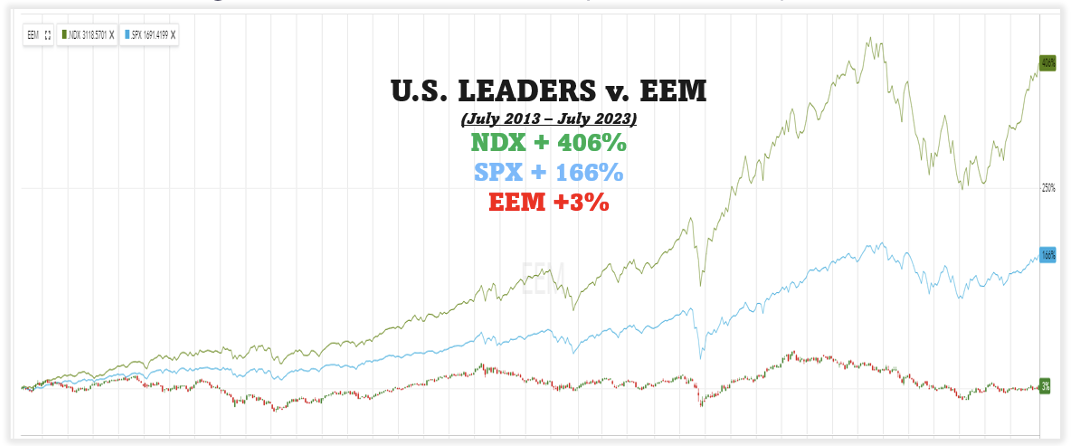
From a price return standpoint, the Emerging Market Index (EEM) is essentially unchanged over the past decade. By comparison, the Nasdaq 100® Index (NDX) has gained more than 400%. The S&P 500 Index (SPX) is up over 160% over the same time frame. EM investors have mostly been left behind and are waiting for the tide to turn.
FIDELITY AND NASDAQ
The Mighty USD
During the most recent Federal Reserve rate hike cycle, the U.S. Dollar rallied to the highest levels in 20 years. The USD peaked in September of last year and has been slowly grinding lower for the past three quarters. Despite the decline, the dollar remains strong on a longer-term basis.
The proverbial tide may turn for EM economies if/when the dollar weakens considerably. The U.S. remains a global superpower – economically, militarily and politically. Thus far concerns over the current debt-to-GDP ratio have not rattled many macro investors.
Will the electric vehicle/clean energy markets catalyze growth in EM economies where the requisite commodities can be mined?
Will the U.S. economy fall into recession and move the Federal Reserve to start reducing rates?
Could there be a geopolitical event that alters nearly 80 years of U.S. hegemony?
Going Forward
The Chinese economy has an outsized influence on the performance of most EM Indexes and the tradeable products designed to track them.
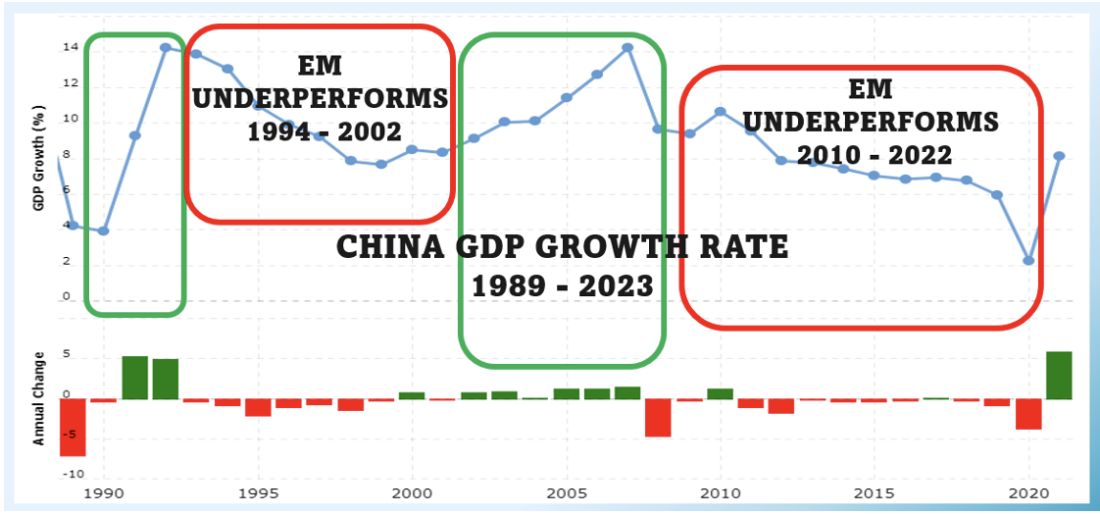
WORLD BANK & NASDAQ
If you believe the 2023 projections for Chinese GDP growth, then perhaps EM investments are approaching an inflection point. The Chinese economy has struggled to maintain a forward trajectory in the “post-pandemic” environment.
Like any investment, there are opportunities and risks. Keep in mind there are option-based strategies that afford market participants the ability to define their exposure over specific time frames.
—
Originally Posted July 24, 2023 – The Next Chapter of Emerging Markets
The views and opinions expressed herein are the views and opinions of the author and do not necessarily reflect those of Nasdaq, Inc.
Disclosure: Nasdaq
Index
Nasdaq® is a registered trademark of Nasdaq, Inc. The information contained above is provided for informational and educational purposes only, and nothing contained herein should be construed as investment advice, either on behalf of a particular security or an overall investment strategy. Neither Nasdaq, Inc. nor any of its affiliates makes any recommendation to buy or sell any security or any representation about the financial condition of any company. Statements regarding Nasdaq-listed companies or Nasdaq proprietary indexes are not guarantees of future performance. Actual results may differ materially from those expressed or implied. Past performance is not indicative of future results. Investors should undertake their own due diligence and carefully evaluate companies before investing. ADVICE FROM A SECURITIES PROFESSIONAL IS STRONGLY ADVISED.
© 2023. Nasdaq, Inc. All Rights Reserved.
Options
For the sake of simplicity, the examples included do not take into consideration commissions and other transaction fees, tax considerations, or margin requirements, which are factors that may significantly affect the economic consequences of a given strategy. An investor should review transaction costs, margin requirements and tax considerations with a broker and tax advisor before entering into any options strategy.
Options involve risk and are not suitable for everyone. Prior to buying or selling an option, a person must receive a copy of Characteristics and Risks of Standardized Options. Copies may be obtained from your broker, one of the exchanges or The Options Clearing Corporation, One North Wacker Drive, Suite 500, Chicago, IL 60606 or call 1-888-OPTIONS or visit www.888options.com.
Any strategies discussed, including examples using actual securities and price data, are strictly for illustrative and education purposes and are not to be construed as an endorsement, recommendation or solicitation to buy or sell securities.
© 2023. Nasdaq, Inc. All Rights Reserved.
Disclosure: Interactive Brokers
Information posted on IBKR Campus that is provided by third-parties does NOT constitute a recommendation that you should contract for the services of that third party. Third-party participants who contribute to IBKR Campus are independent of Interactive Brokers and Interactive Brokers does not make any representations or warranties concerning the services offered, their past or future performance, or the accuracy of the information provided by the third party. Past performance is no guarantee of future results.
This material is from Nasdaq and is being posted with its permission. The views expressed in this material are solely those of the author and/or Nasdaq and Interactive Brokers is not endorsing or recommending any investment or trading discussed in the material. This material is not and should not be construed as an offer to buy or sell any security. It should not be construed as research or investment advice or a recommendation to buy, sell or hold any security or commodity. This material does not and is not intended to take into account the particular financial conditions, investment objectives or requirements of individual customers. Before acting on this material, you should consider whether it is suitable for your particular circumstances and, as necessary, seek professional advice.
Disclosure: Options Trading
Options involve risk and are not suitable for all investors. Multiple leg strategies, including spreads, will incur multiple commission charges. For more information read the "Characteristics and Risks of Standardized Options" also known as the options disclosure document (ODD) or visit ibkr.com/occ


Join The Conversation
If you have a general question, it may already be covered in our FAQs. If you have an account-specific question or concern, please reach out to Client Services.