


Charting TSLA’s Implied Volatility Seasonal Trends
Navigating the ever-shifting landscape of the stock market can be a formidable challenge, especially when it comes to options trading. However, by examining historical seasonal trends, we can uncover valuable insights that empower us to chart a more informed course. In this blog post, we will delve into the intriguing world of Tesla’s (TSLA) implied volatility (IV) during the month of September. While we can’t gaze into a crystal ball, understanding past patterns can provide us with a compass to navigate the uncertain path ahead.
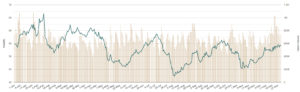
TSLA Seasonal Volatility Chart
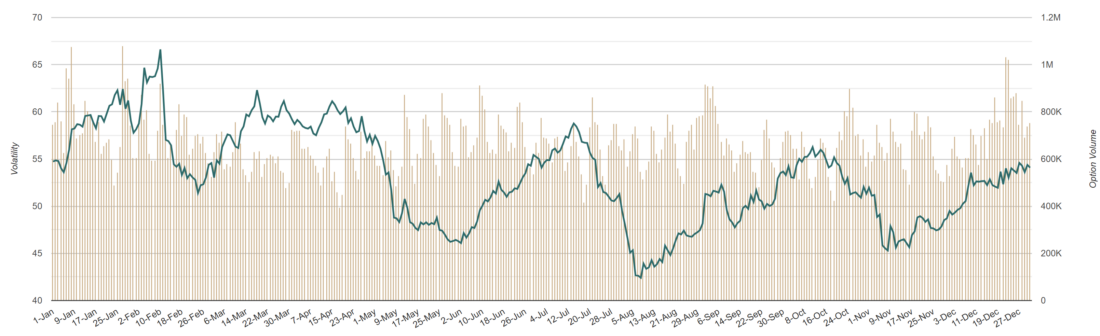
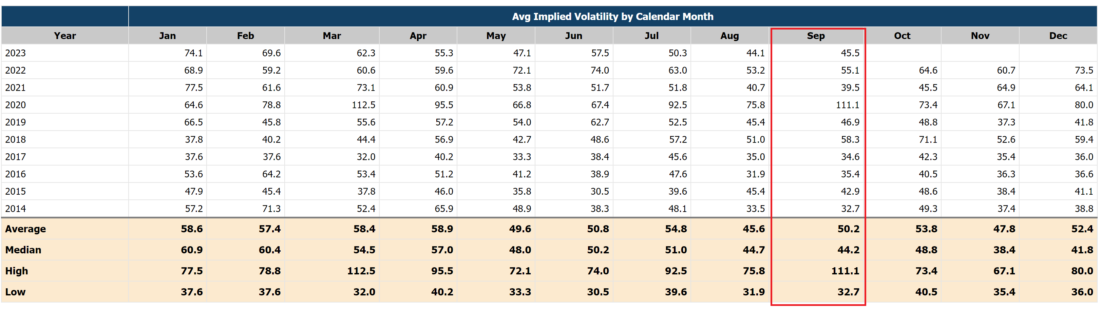
September’s Implied Volatility Patterns
source: marketchameleon
When we analyze TSLA’s implied volatility for September, a fascinating story unfolds. On average, September’s IV registers at 50.2, a notable uptick from the preceding month of August, which averaged 45.6. This suggests that traders and investors are gearing up for potentially more significant price swings in TSLA during September.
However, our historical data unveils that the highest IV levels tend to manifest in January and April, reaching 58.6 and 58.9, respectively. This implies that while September might see an uptick in IV, we may not have reached its peak just yet. History hints that IV can ascend in September and October before embarking on a descent in November.
The IV Landscape Beyond November
If we extend our gaze beyond November, we discover that IV tends to surge post-December, remaining at elevated levels through April. This protracted period of heightened volatility could offer traders ample opportunities to capitalize on TSLA’s price movements during the early months of the year.
Comparing Implied vs. Realized Volatility in September
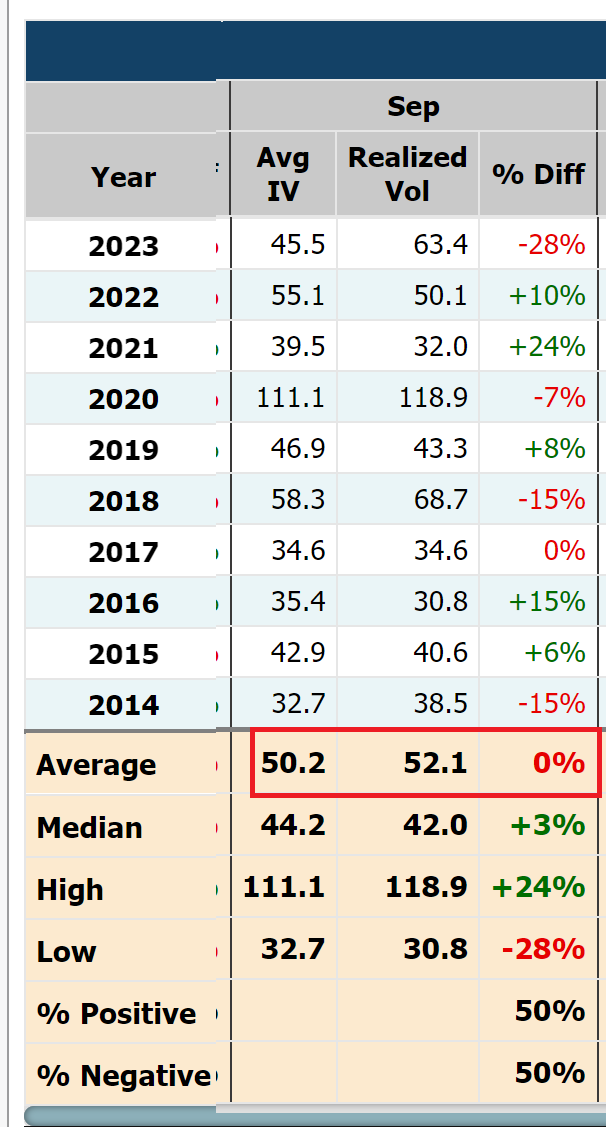
Source: marketchameleon.com
To enrich our understanding, let’s juxtapose historical implied volatility with realized volatility in September. This analysis enables us to evaluate how closely market expectations align with actual price actions.
Historically, implied volatility for September averages 50.2, while realized volatility averages 52.1. This suggests that, in practice, market participants have marginally underestimated actual volatility during this month. In other words, the real price swings tend to be slightly more intense than what traders had anticipated based on implied volatility.
Current September Implied Volatility
As of the present moment, September’s implied volatility for TSLA is 45.4, residing toward the lower end of its historical spectrum. This could signify that market players are bracing for a less turbulent September compared to past years. However, it’s important to remember that lower expectations don’t necessarily translate into milder actual volatility; they might simply reflect reduced uncertainty baked into market pricing.
In Conclusion
While we can’t glimpse into the future, historical seasonality serves as a beacon of guidance. Drawing from past trends, it’s conceivable that implied volatility might experience a gradual ascent over the next two months before embarking on a descent. September’s realized volatility could potentially surpass expectations, especially given its modest starting point.
As you chart your trading journey, remember that seasonality insights are just one star in the constellation of decision-making. Market dynamics evolve, and new factors emerge. Stay vigilant, stay measured, and use historical data as a trusted navigator to inform your trading strategy.
—
Originally Posted September 7, 2023 – Understanding TSLA Implied Volatility Seasonality: Your Roadmap Ahead
Disclaimer:
The information provided in this article is for educational and informational purposes only. It should not be construed as financial or investment advice. Trading and investing in financial markets, including options, carries inherent risks, and past performance is not indicative of future results.
Readers are advised to conduct their own research and due diligence before making any trading or investment decisions. The author and the website do not endorse or recommend any specific trading strategies, securities, or financial products. Any reliance on the information presented in this article is at the reader’s own discretion and risk.
Disclosure: Market Chameleon
The information provided on MarketChameleon is for educational and informational purposes only. It should not be considered as financial or investment advice. Trading and investing in financial markets involve risks, and individuals should carefully consider their own financial situation and consult with a professional advisor before making any investment decisions. MarketChameleon does not guarantee the accuracy, completeness, or reliability of the information provided, and users acknowledge that any reliance on such information is at their own risk. MarketChameleon is not responsible for any losses or damages resulting from the use of the platform or the information provided therein. The 7-day free trial is offered for evaluation purposes only, and users are under no obligation to continue using the service after the trial period.
Disclosure: Interactive Brokers
Information posted on IBKR Campus that is provided by third-parties does NOT constitute a recommendation that you should contract for the services of that third party. Third-party participants who contribute to IBKR Campus are independent of Interactive Brokers and Interactive Brokers does not make any representations or warranties concerning the services offered, their past or future performance, or the accuracy of the information provided by the third party. Past performance is no guarantee of future results.
This material is from Market Chameleon and is being posted with its permission. The views expressed in this material are solely those of the author and/or Market Chameleon and Interactive Brokers is not endorsing or recommending any investment or trading discussed in the material. This material is not and should not be construed as an offer to buy or sell any security. It should not be construed as research or investment advice or a recommendation to buy, sell or hold any security or commodity. This material does not and is not intended to take into account the particular financial conditions, investment objectives or requirements of individual customers. Before acting on this material, you should consider whether it is suitable for your particular circumstances and, as necessary, seek professional advice.


Join The Conversation
If you have a general question, it may already be covered in our FAQs. If you have an account-specific question or concern, please reach out to Client Services.