

")


At the beginning of 2023, Mill Street launched a new report called the Weekly Roundup that provides a “slice” of our broad, institutional research product suite for a much lower price. It is designed to offer highlights and ideas that can be used by individual investors, smaller investment advisors, or institutions looking to get a better feel for the product suite before upgrading to the institutional service.
The Weekly Roundup includes three elements:
- Updates of Mill Street’s Global Equity Risk Model, a multi-indicator composite model designed to help gauge risk and reward for equities and other risky assets on a 1-3 month horizon.
- Concise macro and market commentary, highlighting key macroeconomic, earnings, or market indicators from Mill Street’s large library of data and indicators.
- Stock ideas based on the cornerstone MAER stock ranking model, with 20 buy ideas and 20 avoid ideas drawn from the Russell 1000 index universe each week. MAER charts for each of the stocks in the screen are included in the Chart Appendix linked in the report.
Common question: does it work?
Since one of the most frequent questions we get is about how our models have performed historically, we can take a closer look at results of our hypothetical historical testing for a process that mimics the 20-stock screens from the Russell 1000 shown in the Weekly Roundup. This can be instructive for analyzing model backtests in general and the issues with standard summary statistics when returns do not behave “normally”.
To be clear, all results shown here are hypothetical and do not reflect any actual trading. They do not include important considerations such as transactions costs, liquidity, taxes, and other factors. These results may not have been achievable in practice, and past performance is no guarantee of future results.
Mill Street began producing and saving daily MAER stock ranking data in mid-2019 (previously the data was updated monthly). So we can use the real-time ranking data as it was produced at the time since June 2019 to test the results of a simple weekly screen of the top 20 and bottom 20 ranked stocks within the Russell 1000 index universe. Note that the concentrated portfolio size (20 stocks) and weekly rebalancing will produce higher turnover than our typical MAER portfolio tests (which normally use monthly rebalancing and larger portfolio sizes). And any simple approach like this is not typically how institutional investors would manage a portfolio, as it does not include factors such as diversification, turnover, liquidity, etc. So while we don’t necessarily recommend it as a complete stand-alone trading strategy, this exercise can provide a very basic and straightforward example of how results might look if one were to use the Weekly Roundup screens directly.
Process and basic results
The process in the testing is very straightforward:
- Each week, look at the ranking of Russell 1000 stocks (as they were at the time)
- Form 3 portfolios: the top 20 stocks are the “buy ideas”, the bottom 20 stocks are the “sell/avoid ideas” and the entire universe is the benchmark. All stocks are equally-weighted in each portfolio.
- Rebalance weekly and calculate the daily returns to each portfolio
- Aggregate the daily portfolio returns into monthly returns for easier analysis
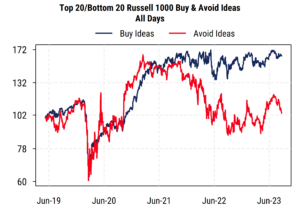
First, the traditional cumulative equity curves for the “buy” and “avoid” lists from this simple screen, and the compound annualized returns and volatilities:

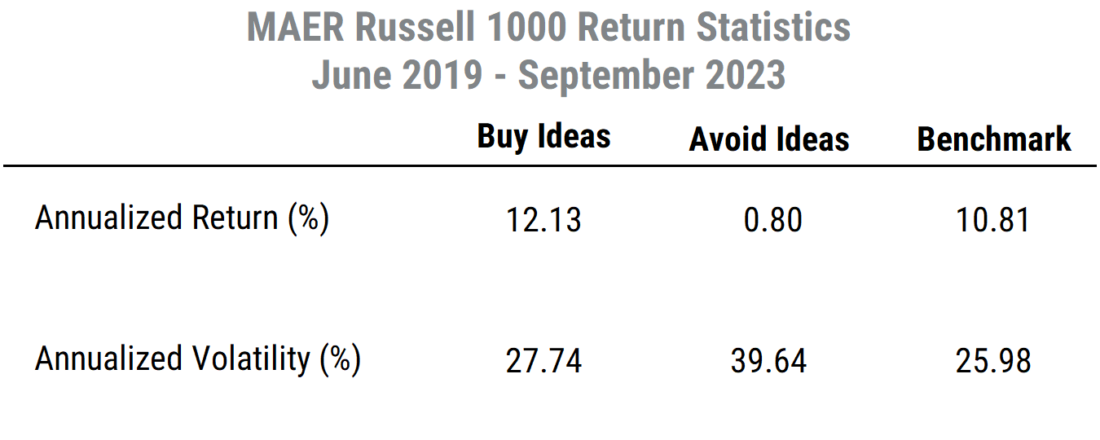
So the buy ideas outperform the avoid ideas by a wide margin (more than 11% annualized), and have much lower volatility (27% vs 39%). The buys outperform the benchmark mildly, with similar volatility, while the avoids underperform badly with much higher volatility.
The difference one day can make
The red line in the chart (the Avoid ideas) have a couple of really noticeable dramatic spikes in 2020 that are not reflected in the Buy ideas (blue line). As it turns out, one specific day’s returns have a pretty substantial impact on the overall results for the Avoid ideas for the 4+ year test period.
That day is November 9, 2020. As many of you may recall, that was the day that Pfizer first announced the success of its COVID-19 vaccine, news that came as a shock to many given how fast it occurred and the efficacy it showed. While stocks had already been rising prior to November 9th thanks to monetary and fiscal stimulus efforts, stocks rose that day, but many mid- and smaller-cap stocks outperformed sharply. The S&P 500 was up 1.2% while the Russell 2000 jumped 3.7%, and our equal-weighted Russell 1000 benchmark universe rose 4.1%.
On that day, many of the stocks that had been underperforming due to the impacts of COVID suddenly reversed and jumped even more dramatically, while those that had been relative beneficiaries of the COVID backdrop and stimulus rose much less or even declined.
While the pattern of returns shifted for some time after November 9th, that single day of returns meaningfully affected the backtest results that we see, with the effect appearing almost entirely in the Avoid ideas results.
The chart below shows the hypothetical results of what returns would look like if we exclude November 9th from the data entirely. That is, the Buy and Avoid ideas returns are both missing November 9th but are otherwise unchanged. The stats below the chart show the annualized returns and volatility when November 9th is excluded.
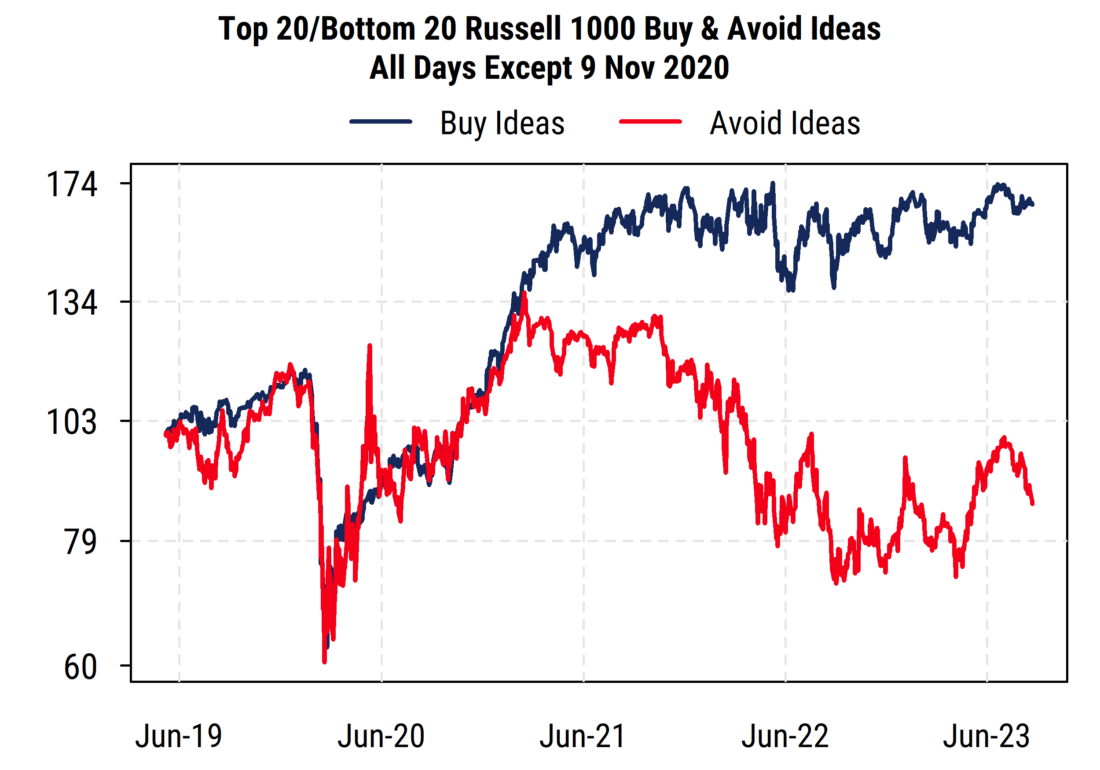
Comparing these results to the first set above shows that excluding November 9th reduces the benchmark (equal-weighted Russell 1000) return by about 1% annualized (roughly, removing a 4% one-day move within a four-year backtest period), while leaving the volatility reading little changed.
And for the Buy Ideas, the return actually rises slightly (from 12.1% to 12.5%) while leaving the volatility unchanged. Thus the outperformance of the Buys versus the benchmark widens noticeably.
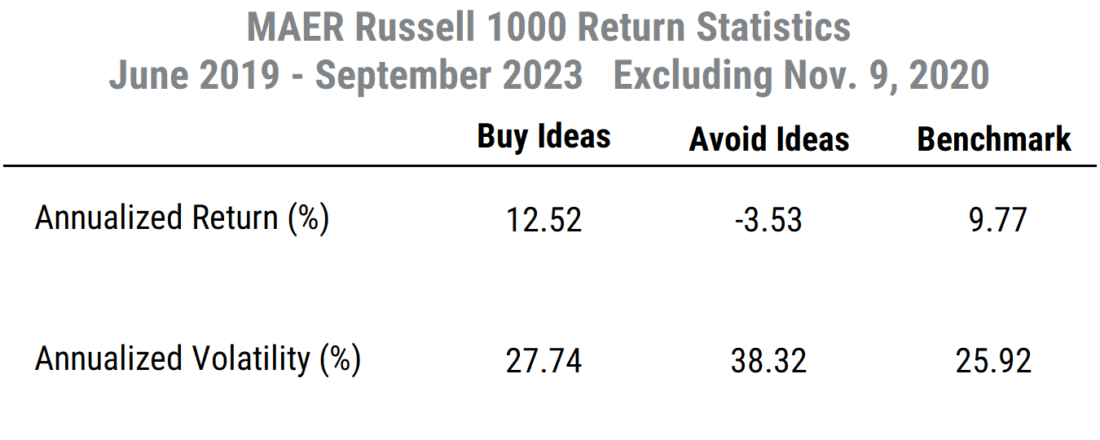
But for the Avoid Ideas, the annualized return drops dramatically, from +0.8% per year to -3.5% per year. The volatility of the Avoids also drops notably, by 1.3% annualized (from 39.6 to 38.3).
That one-day difference, out of 1082 days in the study, changes the cumulative return for the Buys only marginally: from 63.5% to 65.8%. But the Avoids’ cumulative return drops from +3.5% to -14.3%.
This example captures a broader issue of the impact of extreme returns and the “skew” that often occurs with investment strategies that incorporate momentum-based drivers. MAER incorporates earnings momentum as well as price momentum as roughly 70% of its weighting, partly offset by valuation metrics (which are contrarian in nature) and short-term price mean-reversion for the other 30%.
Outliers
We can see this more clearly when looking at the monthly returns to the two portfolios in histograms, which show the frequency of monthly returns in various ranges.
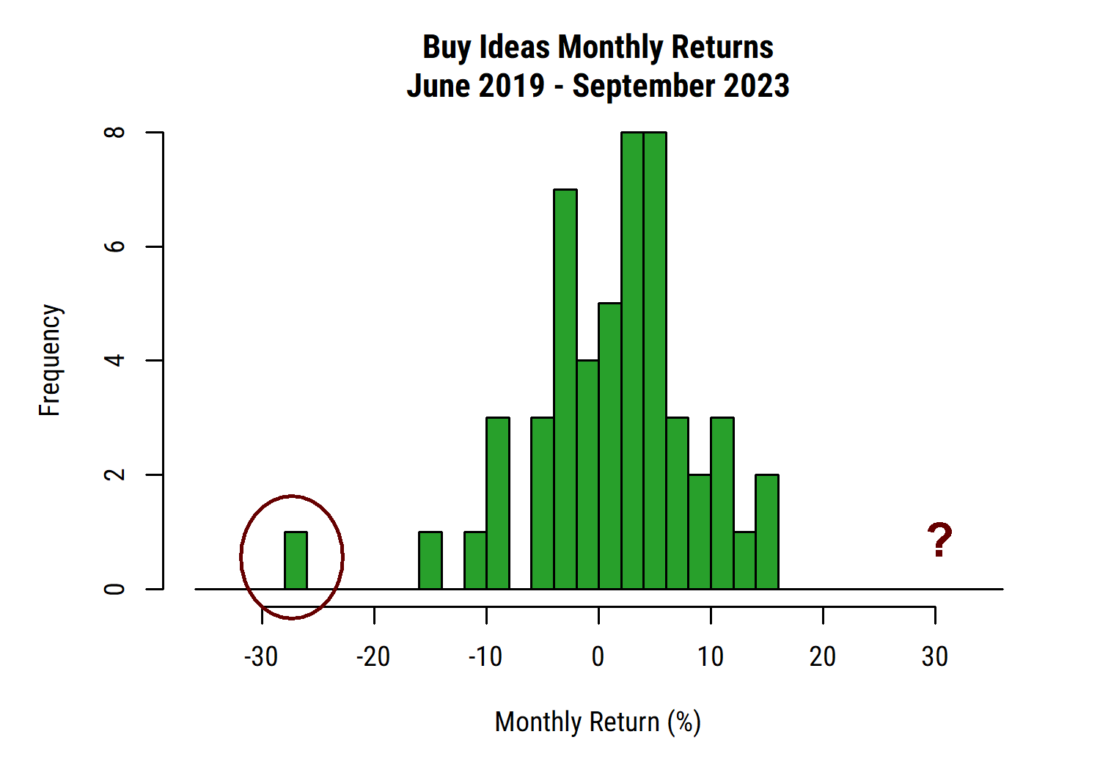
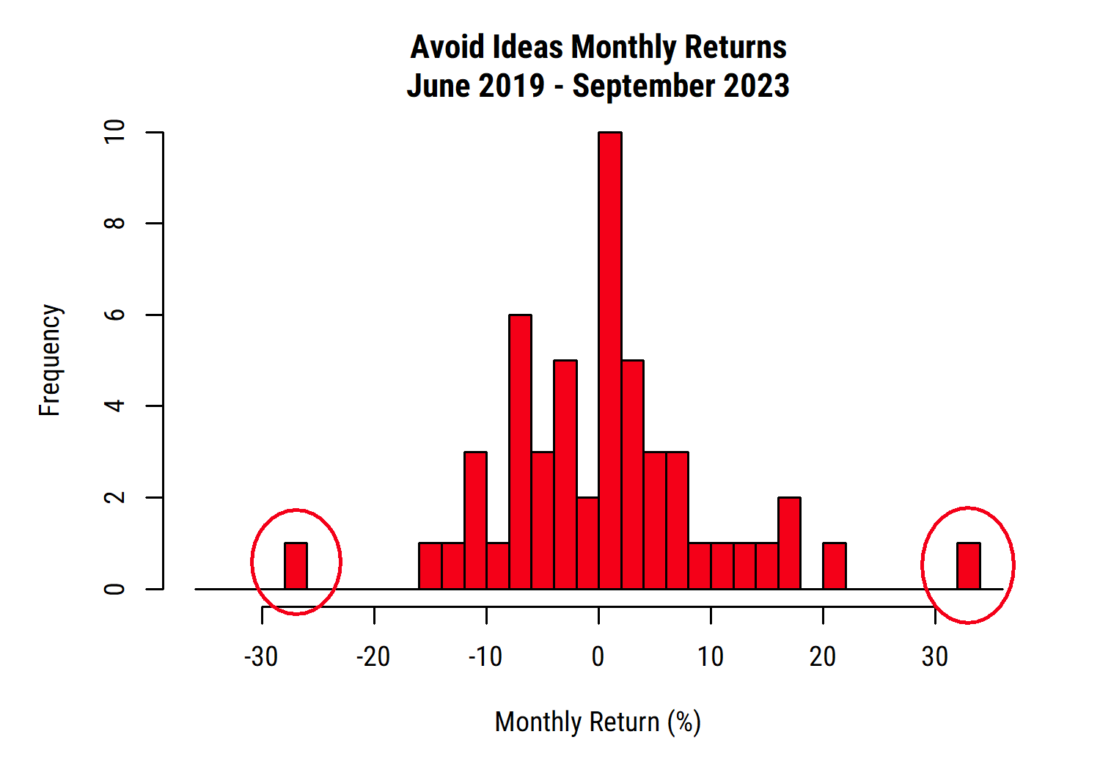
Both the Buy and Avoid ideas charts show a negative outlier of around -27%, which was the month of March 2020 when COVID first hit and markets everywhere plunged. But in this case, both the Buys and Avoids saw roughly equal losses (the benchmark was down 20% as well), so the extreme return affects everything similarly.
But the Avoid ideas chart shows another outlier on the other side, an extreme positive reading, which does not have a similarly sized corresponding outlier in the Buy returns. That is the month of November 2020 (as discussed above), when the Avoids as a group surged 33% while the Buys rose “only” 14%, and the benchmark rose 16%.
“Trimmed mean” to see what “normal” results look like
The remaining monthly returns show a wider range and more negative tilt in the Avoids than in the Buys, as expected. So if we view the extreme months driven by COVID to be extraordinary and not reflective of “normal” market behavior, we can see how the results change if we exclude both the best and worst months from each of the three portfolios. This creates a “trimmed” version of the results excluding the outliers, similar to what is often done with inflation data (e.g. the Trimmed CPI data produced by the Federal Reserve1)
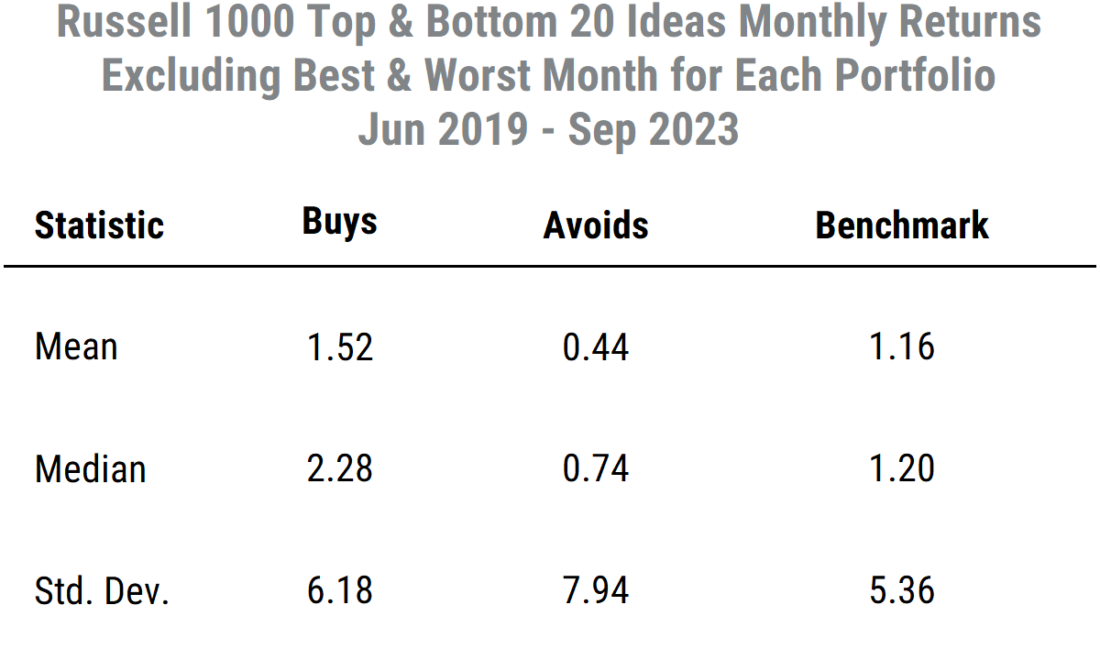
Below are the stats for the monthly returns. The first table shows the returns for all months, while the second shows the “trimmed” version that excludes both the best and worst months for each of the three portfolios.
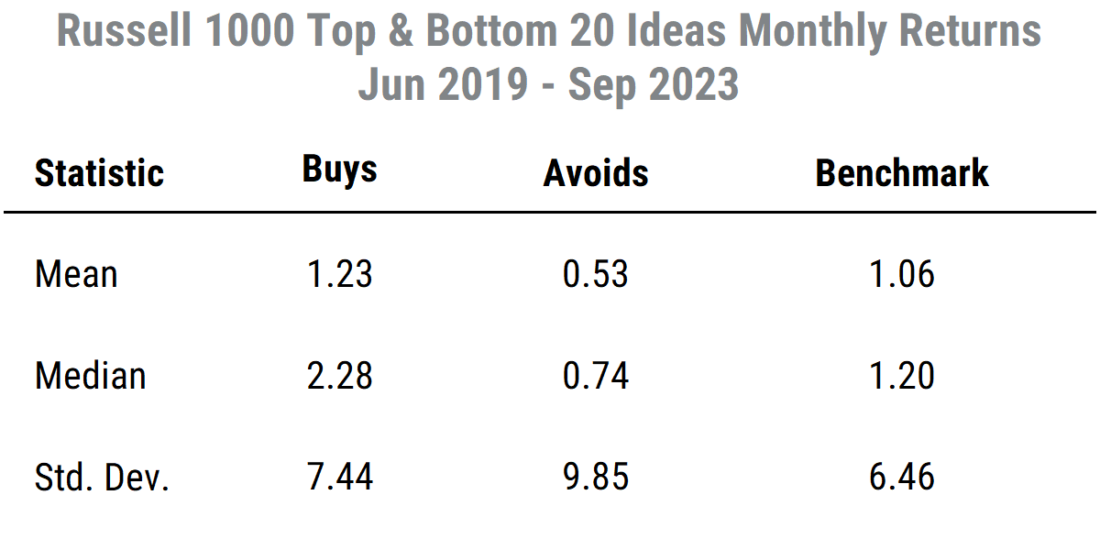
One thing we note when looking at the standard (all months) returns, is the difference between the mean and median returns. For the benchmark, the median is slightly higher than the mean, capturing a slight negative skew (more big negatives than big positives). For the Avoids, the mean is lower than the median by a larger amount, indicating a slightly more negative skew. But for the Buys, the median is much higher than the mean (2.28% vs 1.23%), with the 1% monthly difference equivalent to roughly 12% annualized. That implies a more significant impact from negative outliers on the monthly returns among the Buys.
So we can now look at the “trimmed” results, where we see this impact clearly for the Buys versus Avoids.
Starting with the benchmark (Russell 1000) results, excluding the best and worst months (i.e. 2 of the 52 months in the study) causes the average monthly return to rise slightly (1.06% to 1.16%), moving closer to the median, while leaving the median unchanged (as expected) and reducing the volatility by 1.1% (6.5% to 5.4%).
The Buys show a more substantial increase in the average (mean) return, from 1.23% to 1.52%. This equates to annualized (non-compounded) returns shifting from 14.8% to 18.2%. Volatility naturally drops, and by a similar amount to the benchmark (about 1.3%).
The Avoids, however, show a lower mean (average) return after excluding the best and worst months, counter to the results in the benchmark and Buys. This highlights the greater impact that the positive outlier month had on the Avoid results than on the others. The volatility also declines more (almost 2%) than the other portfolios, but remains higher than the others. So the net result is that dropping both the best and worst months from each portfolio return causes the difference in average monthly returns between Buys and Avoids to widen from 0.7% per month to 1.08% per month, and keeps the difference in median returns at an even wider level of 1.54%.
Conclusion
This deeper dive into what seems like a straightforward backtest highlights some key points about quantitative models like MAER and equity market returns in general:
- Equity returns do not follow the textbook “normal” (Gaussian) distribution, and are well known to be “fat-tailed” (more extreme readings than there “should” be), with the negative tails being the most dramatic in many cases. This affects the interpretation of backtest results and makes the time period chosen have more of an impact.
- Momentum-oriented stock selection strategies often have a “skew” in their results. The favored (high momentum) stocks will have predominantly positive relative returns, but an occasional big loss, while the unfavored (low momentum) stocks will have predominantly weaker relative returns but the occasional big gain.
- The MAER stock ranking model has a tilt toward momentum-type characteristics, so we see the “skew” noted above in the results, though MAER’s construction is designed so that the skew is typically less than what is found in standard textbook price momentum strategies.
- The big “outlier” or skew-driving events typically occur in volatile market conditions when something big happens (e.g. COVID, the vaccine, monetary or fiscal policy responses, etc.). So be careful with quantitative models, particularly momentum-oriented ones, if you suspect such conditions may appear.
- Our results based on real-time rankings over the period since June 2019 show that highly-ranked MAER stocks outperform low-ranked stocks the majority of the time by a significant margin, but 2020 produced some extreme outlier results that have skewed the standard summary statistics somewhat. Even with that skew, the results are favorable, and even more so when viewed excluding the one or two extreme data points, figures that may reflect more typical investment conditions.
1 https://www.atlantafed.org/-/media/documents/research/publications/wp/2014/wp1403.pdf
—
Originally Posted September 27, 2023 – A deeper dive into real-time MAER model results
Disclosure: Mill Street Research
Source for data and statistics: Mill Street Research, FactSet, Bloomberg
This report is not intended to provide investment advice. This report does not constitute an offer or solicitation to buy or sell any securities discussed herein in any jurisdiction where such offer or solicitation would be prohibited. Past performance is not a guarantee of future results, and no representation or warranty, express or implied, is made regarding future performance of any security mentioned in this report.
All information, opinions and statistical data contained in this report were obtained or derived from public sources believed to be reliable, but Mill Street does not represent that any such information, opinion or statistical data is accurate or complete. All estimates, opinions and recommendations expressed herein constitute judgments as of the date of this report and are subject to change without notice.
Disclosure: Interactive Brokers
Information posted on IBKR Campus that is provided by third-parties does NOT constitute a recommendation that you should contract for the services of that third party. Third-party participants who contribute to IBKR Campus are independent of Interactive Brokers and Interactive Brokers does not make any representations or warranties concerning the services offered, their past or future performance, or the accuracy of the information provided by the third party. Past performance is no guarantee of future results.
This material is from Mill Street Research and is being posted with its permission. The views expressed in this material are solely those of the author and/or Mill Street Research and Interactive Brokers is not endorsing or recommending any investment or trading discussed in the material. This material is not and should not be construed as an offer to buy or sell any security. It should not be construed as research or investment advice or a recommendation to buy, sell or hold any security or commodity. This material does not and is not intended to take into account the particular financial conditions, investment objectives or requirements of individual customers. Before acting on this material, you should consider whether it is suitable for your particular circumstances and, as necessary, seek professional advice.


Join The Conversation
If you have a general question, it may already be covered in our FAQs. If you have an account-specific question or concern, please reach out to Client Services.