


Apple Inc. (AAPL) recently reported its earnings on August 3, after the market closed. The stock gapped down -3% at the open the next day and finished down -3.2% on the day. In this blog post, we will examine how this recent earnings move compares to AAPL’s historical earnings move patterns and what history suggests may come next.
Gap Move Comparison
AAPL Historical Stock Price Moves Around Earnings
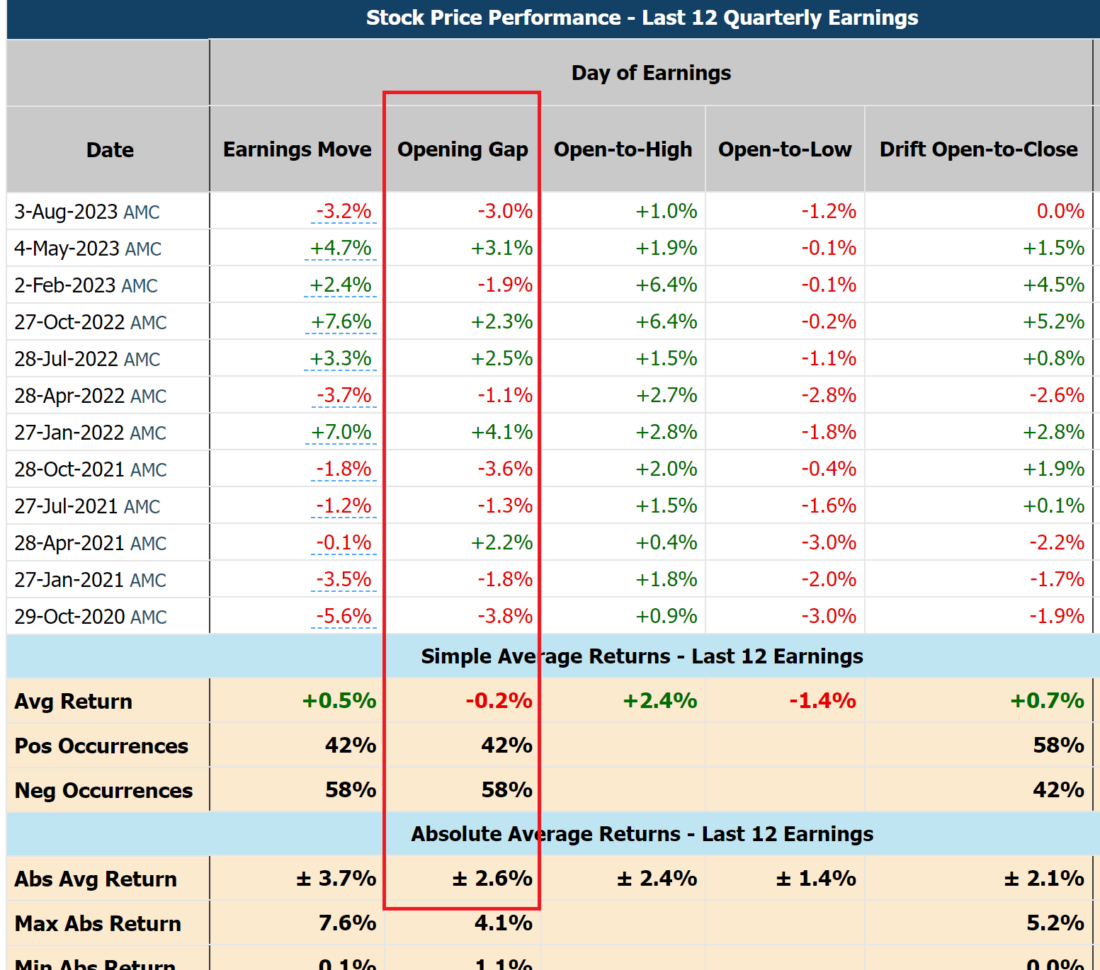
By analyzing the last three years of earnings data, we find that, AAPL opened lower 58% of the time. This means that it is not uncommon for the stock to gap down after reporting earnings. The -3% decline was only slightly larger than average +/- 2.6% move.
The largest historical move to the upside was +4.1%, while the largest downside move was -3.7%. AAPL’s recent earnings reaction of -3% is within its historical range and demonstrates consistent stock price behavior.
So, What’s Next?
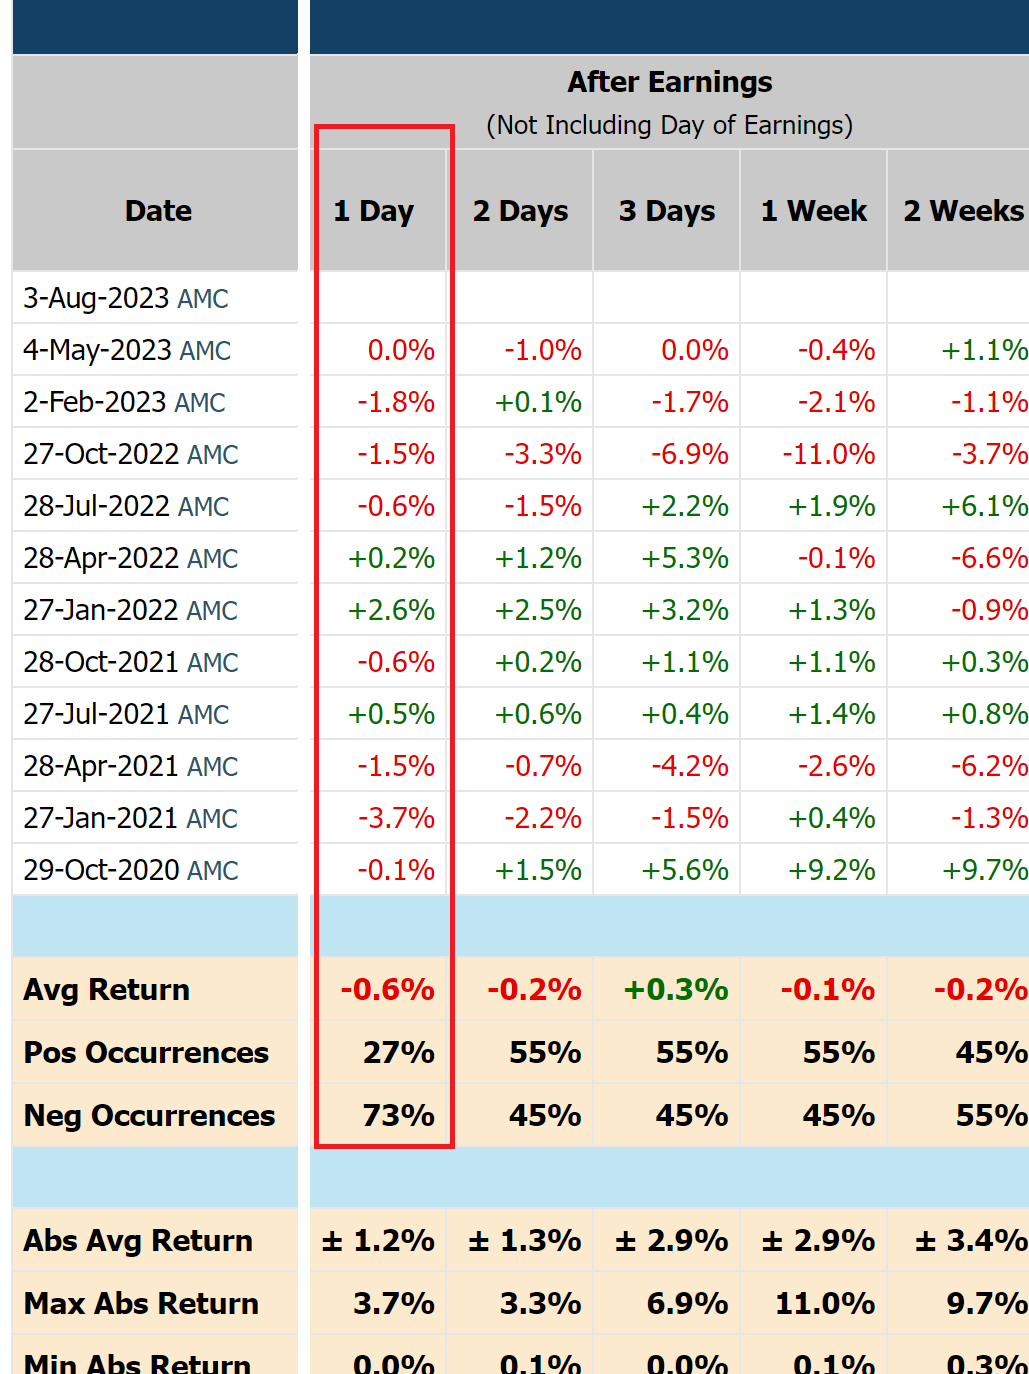
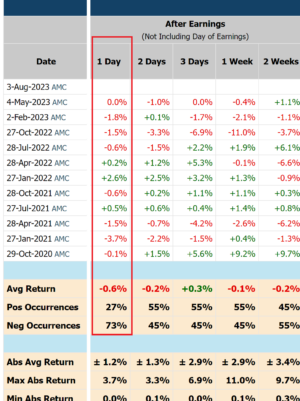
Although it is impossible to be certain about future stock price movement, historical data provides some helpful insights. Over the last three years, AAPL stock fell 73% of the time on the day after reporting earnings, with an average loss of -0.6%. This trend suggests that traders tend to exit bullish positions, which has led to post-earnings weakness. So if history is any guidance, AAPL has a higher chance to fall after earnings and follow suit the next day. Which, at the time of this writing, was exactly what happened.
Conclusion
Based on the analysis of AAPL’s stock movement after earnings from recent and historical price patterns, the recent -3% gap down is only slightly higher than the average (+/-2.6%). Interestly, the stock price declined this time, which was in line with the majority of the outcomes (58%).
Looking ahead, historical data suggested that AAPL could experience some weakness on the day after reporting earnings, as was the case at the time of this writing.
Remember that historical patterns are not guarantees of future performance, and it is essential to consider various factors and conduct thorough research before making investment decisions. As the market is influenced by a multitude of variables, it is always prudent to approach trading and investing with caution and a well-informed strategy.
—
Originally Posted August 4, 2023 – AAPL Historical Earnings Moves and What Does History Suggest?
Disclaimer
The information provided in this blog is for educational and informational purposes only and should not be considered as financial advice. Always do your research and consult with a qualified financial advisor before making investment decisions.
Disclosure: Market Chameleon
The information provided on MarketChameleon is for educational and informational purposes only. It should not be considered as financial or investment advice. Trading and investing in financial markets involve risks, and individuals should carefully consider their own financial situation and consult with a professional advisor before making any investment decisions. MarketChameleon does not guarantee the accuracy, completeness, or reliability of the information provided, and users acknowledge that any reliance on such information is at their own risk. MarketChameleon is not responsible for any losses or damages resulting from the use of the platform or the information provided therein. The 7-day free trial is offered for evaluation purposes only, and users are under no obligation to continue using the service after the trial period.
Disclosure: Interactive Brokers
Information posted on IBKR Campus that is provided by third-parties does NOT constitute a recommendation that you should contract for the services of that third party. Third-party participants who contribute to IBKR Campus are independent of Interactive Brokers and Interactive Brokers does not make any representations or warranties concerning the services offered, their past or future performance, or the accuracy of the information provided by the third party. Past performance is no guarantee of future results.
This material is from Market Chameleon and is being posted with its permission. The views expressed in this material are solely those of the author and/or Market Chameleon and Interactive Brokers is not endorsing or recommending any investment or trading discussed in the material. This material is not and should not be construed as an offer to buy or sell any security. It should not be construed as research or investment advice or a recommendation to buy, sell or hold any security or commodity. This material does not and is not intended to take into account the particular financial conditions, investment objectives or requirements of individual customers. Before acting on this material, you should consider whether it is suitable for your particular circumstances and, as necessary, seek professional advice.

")

Join The Conversation
If you have a general question, it may already be covered in our FAQs. If you have an account-specific question or concern, please reach out to Client Services.