


Yesterday we discussed how the recent low readings in volatility indices like VIX (Cboe Volatility Index) can be somewhat explained by the relatively low levels of equity market correlation that we have seen recently. Yet we also noted that while correlations between VIX and COR1M, the Cboe 1-Month Correlation Index, have been high, the relationship is far from perfect. The difference might simply be statistical noise, but I posit that it is more about investors being sanguine, if not blasé, about market risk.
In a recent podcast about this topic, I offered the following:
… VIX is the price of parachutes when a plane hits turbulence. This comes from my experience as a market maker. Nobody really wants umbrellas when it’s when there’s a drought, nobody really thinks about a parachute if the plane is moving along smoothly at 30,000 feet, but as soon as you hit some turbulence, or as soon as the rain clouds develop, people want them and they want them in a hurry.
Someone once told me that when a plane hits turbulence, look at the flight attendants. If they seem unconcerned, then what you’re experiencing is relatively normal even if it seems scary. If you share my view that options markets have a similar role relative to the equity markets, there was little concern about last month’s swoon. The bout of selling was hardly a full correction, with the drops in major indices falling well short of the 10% level that typifies a correction.
But I’ve begun to wonder whether that the lack of concern is more backward than forward looking, especially when VIX has recently failed to keep pace with rising levels of equity correlation. Although many of us think of VIX as a “fear gauge”, it is important to keep in mind that is not how the index is constructed. As we’ve noted frequently:
VIX is not a fear gauge. It just plays one on TV…
The gist of that comment is that while VIX is constructed to be the market’s best estimate of volatility over the coming days, that estimate is highly dependent upon investors’ recent experience. If markets have been cool, calm, and collected, even in the face of some rocky days, then it is reasonable for investors to project that behavior forward. This is known as recency bias, where individuals place greater weight on events that occurred recently over those that took place longer ago.
We’ve all heard the phrase “the trend is your friend”, and to some extent that applies here. If there is a definable trend, traders throughout time have generally found it profitable to follow, rather than buck the trend. Trend changes are turning points, and it is much easier to spot and follow a trend than to perceive turning points. Market psychology rarely changes unless it has a reason to. We defined this several months ago as an “inertial market”, paraphrasing Newton’s Second Law of Motion to state that a market that is in motion tends to stay in motion unless acted upon by an outside force.
If rising interest rates, multiple expansion, and disappointment over both China’s recovery and potential stimulus are not enough to disrupt the generally risk-tolerant vibe of US equity markets, then sure, there is little desire or even need for investors to seek volatility protection. The relatively low level of VIX implies that September will offer only modest volatility and little need for protection, even with an FOMC meeting amidst a seasonally tricky month – even with market correlations beginning to increase.
This brings to mind another common market mantra, “past performance is not indicative of future results.” That is usually a boilerplate statement required by compliance, but it is rooted in truth. Markets do find their turning points, and usually at the most inopportune time. Ask yourself if the currently sanguine nature of many investors is reflecting proper caution, and whether VIX is properly reflecting low correlations or complacency.
6-Month Chart, COR1M (blue/white daily bars) vs. VIX (red line)
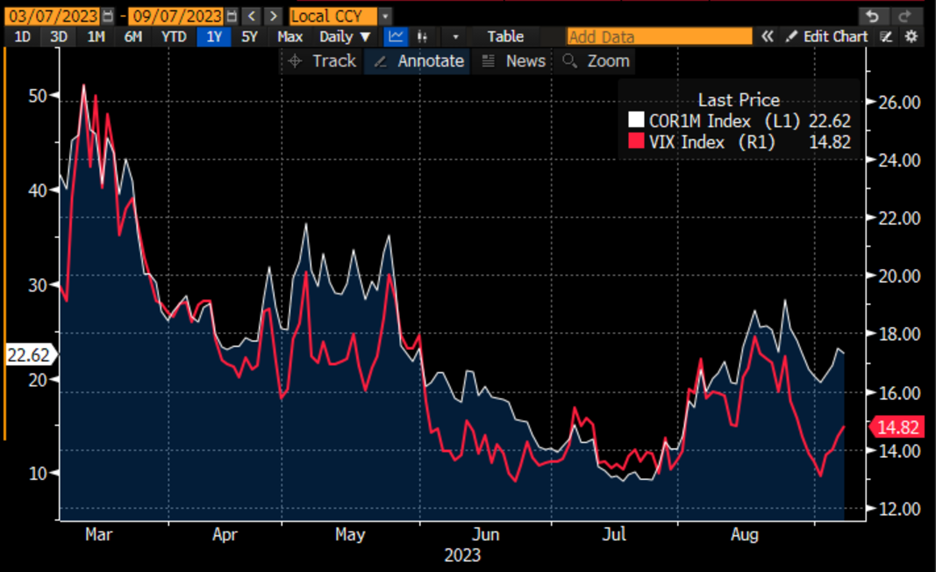
Source: Bloomberg
Disclosure: Interactive Brokers
The analysis in this material is provided for information only and is not and should not be construed as an offer to sell or the solicitation of an offer to buy any security. To the extent that this material discusses general market activity, industry or sector trends or other broad-based economic or political conditions, it should not be construed as research or investment advice. To the extent that it includes references to specific securities, commodities, currencies, or other instruments, those references do not constitute a recommendation by IBKR to buy, sell or hold such investments. This material does not and is not intended to take into account the particular financial conditions, investment objectives or requirements of individual customers. Before acting on this material, you should consider whether it is suitable for your particular circumstances and, as necessary, seek professional advice.
The views and opinions expressed herein are those of the author and do not necessarily reflect the views of Interactive Brokers, its affiliates, or its employees.


Join The Conversation
If you have a general question, it may already be covered in our FAQs. If you have an account-specific question or concern, please reach out to Client Services.