

")


AMZN’s Historical Seasonality with MarketChameleon
As an active investor, you’re always seeking insights that can help you navigate the often-turbulent waters of the stock market. While past performance is not necessarily indicative of future results, understanding historical seasonality patterns can provide valuable clues about potential trends and opportunities.
Traditionally, the month of November has been a favorable period for the stock market, often exhibiting positive returns. Given this trend, we decided to examine how AMZN stock has typically performed during November.
AMZN’s November Performance
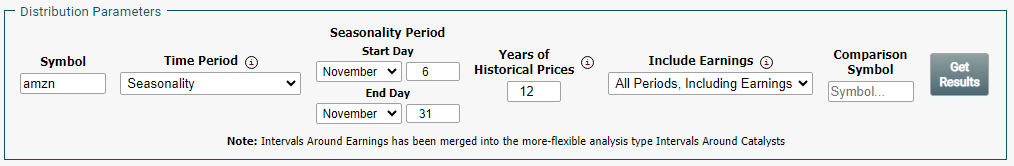
Using MarketChameleon’s Historical Price Return Distribution tool, we set the seasonality period from November 6th to the end of the month and analyzed AMZN’s historical performance data.

The results revealed that AMZN stock has produced positive returns 67% of the time during this calendar period, with an average return of +2.45%.
The median return for November was +1.85%, indicating that the majority of the time, AMZN has experienced positive returns during this month. Interestingly, the average of the positive moves was +5.73%, while the negative moves averaged -4.11%, suggesting that AMZN’s positive returns tend to be more significant than its negative ones.
To further assess AMZN’s performance range, we examined the high-low range for November. The best performance recorded was +14.2%, while the worst was -11.2%, indicating a skew towards the upside.
Visualizing AMZN’s Seasonality
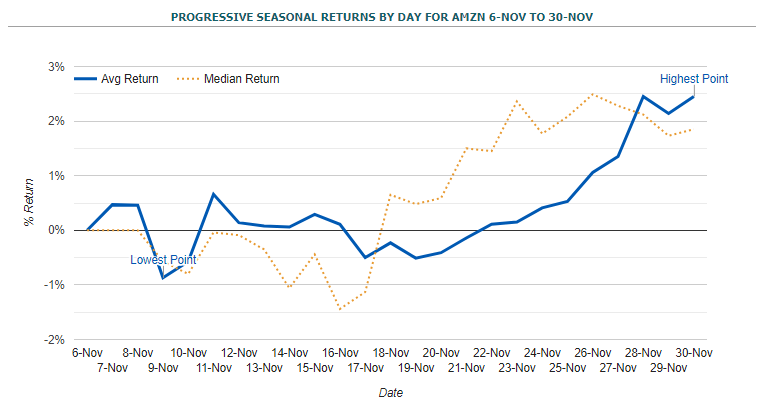
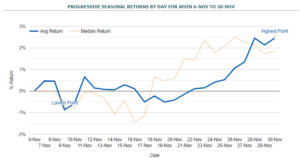
To gain a deeper understanding of AMZN’s historical seasonality, we generated a graph depicting the average and median performance over time. The graph revealed that AMZN’s peak performance during November typically occurs towards the end of the month. Interestingly, the stock appears to start gaining momentum around November 16th, as the first part of the month can be somewhat volatile.
Conclusion
Based on our analysis of historical seasonality patterns, AMZN has a tendency to perform well during the month of November. Positive returns, volatility potential, and a skew towards upside gains make it an intriguing period for investors. While past performance is not a guarantee of future results, these insights can provide valuable context for investors making informed decisions.
—
Originally Posted November 6, 2023 – How AMZN’s November Performance Stacks Up
Disclaimer:
The information contained in this article is for informational purposes only and should not be construed as financial advice. Market Chameleon does not provide investment advice and does not endorse or recommend any specific investment strategies or securities. Investors should always do their own research and consult with a financial advisor before making any investment decisions.
Disclosure: Market Chameleon
The information provided on MarketChameleon is for educational and informational purposes only. It should not be considered as financial or investment advice. Trading and investing in financial markets involve risks, and individuals should carefully consider their own financial situation and consult with a professional advisor before making any investment decisions. MarketChameleon does not guarantee the accuracy, completeness, or reliability of the information provided, and users acknowledge that any reliance on such information is at their own risk. MarketChameleon is not responsible for any losses or damages resulting from the use of the platform or the information provided therein. The 7-day free trial is offered for evaluation purposes only, and users are under no obligation to continue using the service after the trial period.
Disclosure: Interactive Brokers
Information posted on IBKR Campus that is provided by third-parties does NOT constitute a recommendation that you should contract for the services of that third party. Third-party participants who contribute to IBKR Campus are independent of Interactive Brokers and Interactive Brokers does not make any representations or warranties concerning the services offered, their past or future performance, or the accuracy of the information provided by the third party. Past performance is no guarantee of future results.
This material is from Market Chameleon and is being posted with its permission. The views expressed in this material are solely those of the author and/or Market Chameleon and Interactive Brokers is not endorsing or recommending any investment or trading discussed in the material. This material is not and should not be construed as an offer to buy or sell any security. It should not be construed as research or investment advice or a recommendation to buy, sell or hold any security or commodity. This material does not and is not intended to take into account the particular financial conditions, investment objectives or requirements of individual customers. Before acting on this material, you should consider whether it is suitable for your particular circumstances and, as necessary, seek professional advice.


Join The Conversation
If you have a general question, it may already be covered in our FAQs. If you have an account-specific question or concern, please reach out to Client Services.