

")


A few months ago, I wrote a blog post giving a brief history of the development of Mill Street’s MAER stock selection model and comparing the in-sample and out-of-sample test results now that it has been just over 10 years since the current model was originally launched.
The key metric I showed was the Information Coefficient (IC), which is the correlation between the decile ranks of the stocks and the decile rank of their subsequent 1-month returns (it can be done on other return horizons as well).
To visualize it, this is a stylized hypothetical example of what a 100% information coefficient could look like: perfect linear relationship between the decile rank and the return in the subsequent month. An IC of -100% would be the exact opposite: top decile ranked stocks would have the lowest next-month return, etc.
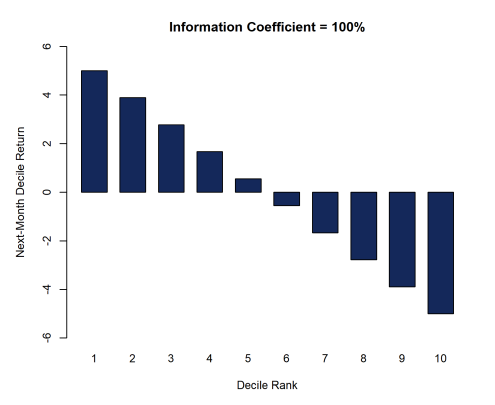
Source: Mill Street Research
This is an example of what a 50% IC could look like: higher ranks have better next-month returns than lower ranks on average, but the relationship is more mixed.
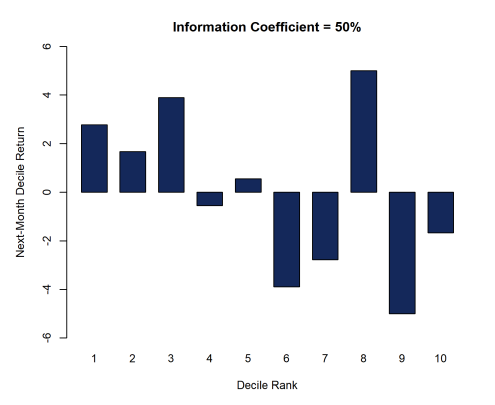
Source: Mill Street Research
A 0% IC would show no relationship between decile ranks and returns at all (just random results). If a stock ranking has no predictive ability, we would expect the average IC over a longer period to be near zero.
Why focus on the IC rather than a traditional portfolio-based backtest? Well, I have done MANY portfolio-based backtests and they are indeed much of the focus when discussing MAER with clients — the results of the standard decile-based backtest are included at the end of this post.
But the key issue is that one must make many decisions about how to create portfolios based on an underlying ranking model (or alpha score), and any of those decisions can produce seemingly different results in the test.
Portfolio returns = stock ranking + portfolio construction constraints
The differences in backtest results caused by differing portfolio construction decisions will in many cases simply reflect the constraints imposed in the portfolio construction process, rather than the underlying ranking itself.
That is, a single ranking of stocks can produce an almost infinite array of possible portfolio results depending on the portfolio construction rules used. Varying the rules can thus cause random variability in the results that is not directly related to the ranking itself.
What kinds of portfolio construction choices can make notable differences? Big ones include:
- Universe of investable stocks: Global/US/etc, large/small-cap, sector, style, liquidity, etc.
- Trading rules: buy and sell rules (simple or complex), which may incorporate turnover constraints
- Diversification: concentration constraints, sector neutrality, etc.
- Benchmarking: are you required to regulate tracking error versus a benchmark index?
Using an Information Coefficient also mitigates the impact of “fat tails” or skewed return distributions when comparing results, i.e., extreme returns in a small proportion of return periods can skew portfolio-based returns, while correlations are typically less impacted by this. It may also be easier to gauge the statistical significance of series of ICs relative to portfolio returns, since ICs are bounded between -1 and +1 by construction.
The issue of “fat tails” or skewed distributions can be particularly important because backtests of ranking models typically assume trading only the highest or lowest ranked stocks (i.e., the tails of the ranking), ignoring most of the ranking in between the tails. The results of such a backtest might not tell you if there is indeed an overall linear relationship between ranks and future returns.
That is, you can find model results in which the top decile outperforms the bottom decile on average, but the ranks are not in fact linearly related to returns (i.e., the middle quantiles actually do better than the top, etc.), which raises questions about the model’s efficacy that would not be answered by a typical portfolio backtest.
IC results for MAER
In the earlier post, I discussed the key result of the 10-year out-of-sample IC analysis: the average decile-based IC for the global stock universe was essentially the same (fractionally better) out-of-sample as it was in-sample . Given the common result found with many quantitative models that out-of-sample results deteriorate after publication/launch, this is a striking result.
Below are updated IC results for not just the global universe but additional key subsets of Developed Market stocks, US stocks, All Ex-US stocks, and European stocks. These additional stock universe tests show that the global results are robust. All Newey-West adjusted t-statistics are well above typical significance thresholds, and are consistent between the in-sample (2003-2012) and out-of-sample (2013-present) periods.
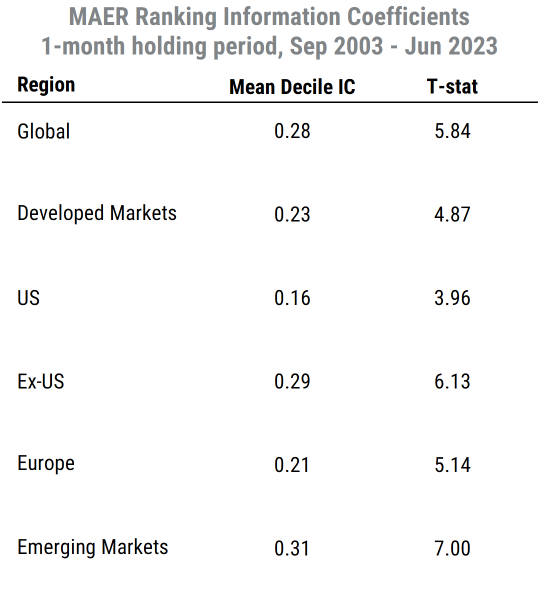
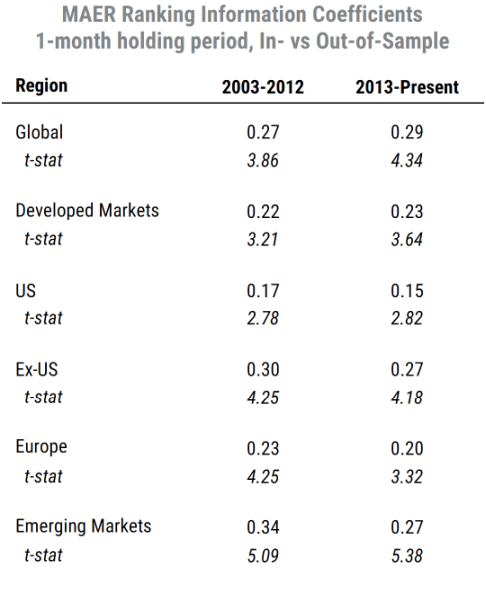
Source: Mill Street Research
Traditional decile backtest
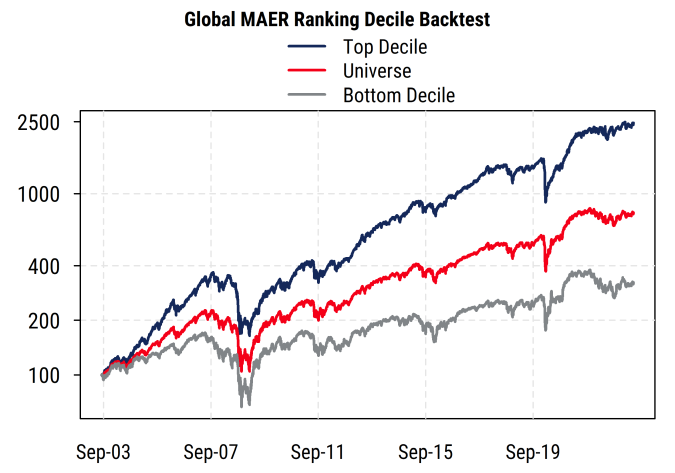
Of course, we also have traditional portfolio backtests using top vs bottom decile ranks as a simple test. The one shown here uses the 6000-stock global universe, assumes rebalancing to own the top decile or bottom decile at the start of each month, and has no other constraints (diversification, etc.). No costs are included in this test as we are mostly focused on relative results. Stocks are equally-weighted within all portfolios (recall that the MAER universe does not include any microcaps or stocks with low liquidity or analyst coverage).
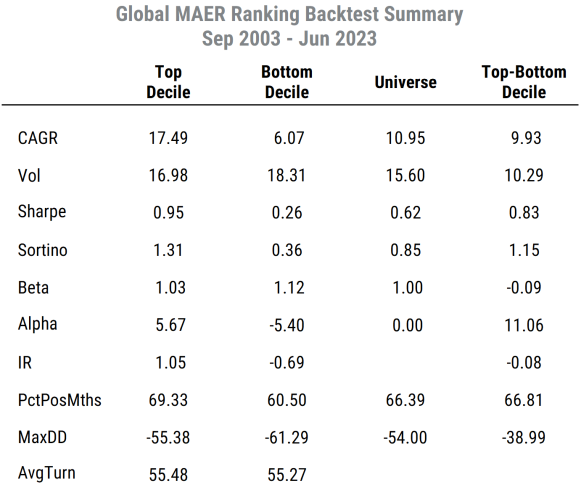
Those results for the global universe are shown below (chart shows value of a hypothetical $100 investment in 2003). In the test, top-ranked stocks outperform bottom-ranked stocks by wide margin (11+% return differential), and top-ranked stocks have somewhat lower volatility and beta than bottom-ranked stocks, so risk-adjusted returns are somewhat stronger.
Note that while these results do not include any transactions costs (so actual returns for both top and bottom decile would be lower after costs), the difference in returns would be the same since turnover is the same for both top and bottom deciles.
Source: Mill Street Research
The pre-cost estimated information ratio (IR) for the top decile portfolio versus the benchmark is 1.05 (IR = relative return divided by standard deviation of relative return), which is quite strong for a 20-year period.
The estimated t-statistic for the top decile relative performance versus the benchmark based on the Information Ratio would be 3.7 (i.e., highly significant), which confirms the strong statistical significance of the results when looking only at the top decile performance versus benchmark alone. The results are sufficiently strong that they would likely be favorable even after reasonable transactions costs.
The key result is that the Information Coefficient and traditional decile-based backtests give similarly strong indications that the MAER ranking would have been a useful guide to relative equity performance over the last 20 years, and that performance in the 10-year out-of-sample period since the model was constructed has been robust and held up remarkably well.
Many clients have found MAER to be a useful tool for years for reasons other than the quantitative backtest results, and “quantamental” clients are perhaps the most common category: investors with a fundamental approach who also want the discipline and structure of having a transparent, quantitative tool they can use. These studies are always hypothetical and are not designed to reflect real trading strategies, but help provide a rigorous quantitative answer to the more general question “is there useful information in the MAER ranking?”, where the answer seems to (still) be “yes”.
—
Originally Posted July 3, 2023 – Mill Street Research MAER Stock Ranking Model: Do You See What IC?
Disclaimer:
Backtest results are purely hypothetical for informational purposes only, do not reflect any actual trading, and any actual results could vary significantly from backtest results. Past performance is no guarantee of future results. Mill Street Research does not manage money. More information is available on request.
Disclosure: Mill Street Research
Source for data and statistics: Mill Street Research, FactSet, Bloomberg
This report is not intended to provide investment advice. This report does not constitute an offer or solicitation to buy or sell any securities discussed herein in any jurisdiction where such offer or solicitation would be prohibited. Past performance is not a guarantee of future results, and no representation or warranty, express or implied, is made regarding future performance of any security mentioned in this report.
All information, opinions and statistical data contained in this report were obtained or derived from public sources believed to be reliable, but Mill Street does not represent that any such information, opinion or statistical data is accurate or complete. All estimates, opinions and recommendations expressed herein constitute judgments as of the date of this report and are subject to change without notice.
Disclosure: Interactive Brokers
Information posted on IBKR Campus that is provided by third-parties does NOT constitute a recommendation that you should contract for the services of that third party. Third-party participants who contribute to IBKR Campus are independent of Interactive Brokers and Interactive Brokers does not make any representations or warranties concerning the services offered, their past or future performance, or the accuracy of the information provided by the third party. Past performance is no guarantee of future results.
This material is from Mill Street Research and is being posted with its permission. The views expressed in this material are solely those of the author and/or Mill Street Research and Interactive Brokers is not endorsing or recommending any investment or trading discussed in the material. This material is not and should not be construed as an offer to buy or sell any security. It should not be construed as research or investment advice or a recommendation to buy, sell or hold any security or commodity. This material does not and is not intended to take into account the particular financial conditions, investment objectives or requirements of individual customers. Before acting on this material, you should consider whether it is suitable for your particular circumstances and, as necessary, seek professional advice.


Join The Conversation
If you have a general question, it may already be covered in our FAQs. If you have an account-specific question or concern, please reach out to Client Services.