


Tech stocks have been soaring, but can this outperformance be sustained or will this artificial intelligence (AI) driven boom mimic the internet explosion and subsequent bust of the 2000-2002 period?
Today, gains in the sector are concentrated in large companies like Nvidia and Meta, with year-to-date (YTD) returns standing at 225% and 148% respectively, subsequently causing the Nasdaq 100 to outperform the S&P 500 by around 25% YTD1, mostly due to its extra weighting in the Tech sector (~60% vs ~27%)2.
This rally has been accompanied by a significant expansion in valuation multiples, specifically the price-to-sales (P/S) ratio. Particularly relevant for the Tech sector, the P/S ratio offers a way to evaluate companies that may not yet be profitable but are generating sales—a common scenario among new and innovative firms. For many in the Tech sector today, this ratio has soared to unprecedented levels.
Figure 1: A long time series shows 3 distinct peaks in price-to-sales ratios of Tech stocks
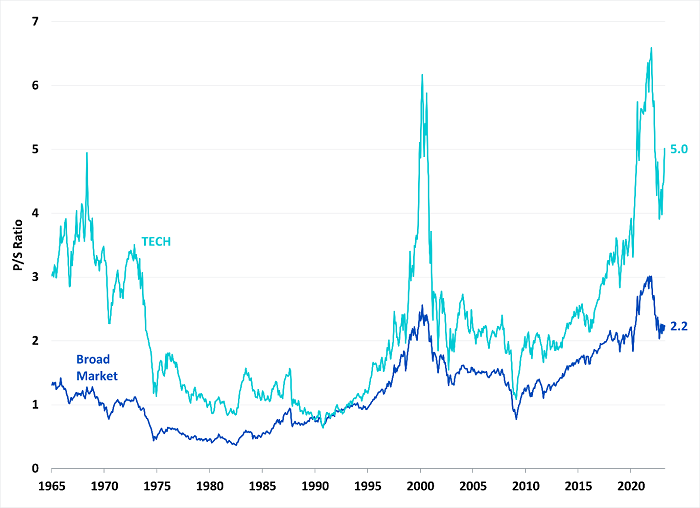
Source: Research conducted for ‘Stocks for the Long Run 6th Edition’, Jeremy Siegel with Jeremy Schwartz (2022).
Historical performance is not an indication of future performance and any investments may go down in value.
At the end of March 2023, Nvidia became the company with the highest P/S ratio in both the S&P 500 and Nasdaq 100 indices. It has only increased since then, reaching a P/S ratio of over 40, which is based on the trailing 12 months of sales. Nvidia’s quarterly earnings report, however, did forecast a large (60%) jump in future sales, so analysts are now pricing in future sales which brings down the multiple to 25 times expected sales over next 12 months3.
This leads us to our key question: based on a historical sample of companies that have reached these valuations in the past, what are the chances that Nvidia can continue to outperform?
The research in this piece will explore the implications of high P/S valuations, which will be defined as 25 or over (coincident with Nvidia’s price over expected sales), on future company performance.
P/S ratios: from rarity to normality
From the late 1960s to the early 1990s, it was uncommon to find a company with a P/S ratio over 25. When it did happen, it was one or two firms each year, and the percentage of the total market cap they represented was negligible.
Today, high P/S ratios have become routine, especially in the Tech sector: is this the new normal?
Figure 2: Number of companies and percent of market cap by companies in the Top 500 caps with P/S > 25 each year
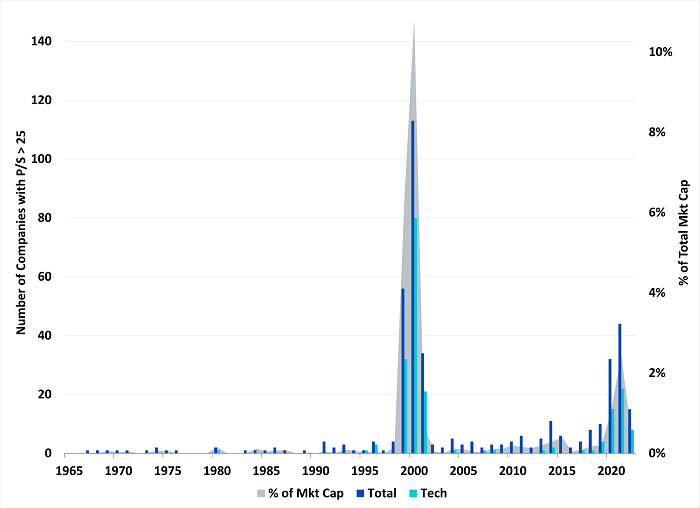
Source: Research conducted for ‘Stocks for the Long Run 6th Edition’, Jeremy Siegel with Jeremy Schwartz (2022).
Historical performance is not an indication of future performance and any investments may go down in value.
Figure 2 shows the number of companies in the largest 500 companies that reached a P/S ratio of 25 or above at least once within each calendar year, alongside the percentage of total market cap that these companies represent.
The tech bubble of 1999-2002 saw a drastic surge in companies with high P/S ratios. In 1999, there were 56 companies with a P/S ratio over 25, representing over 6% of the total market cap. The trend peaked in 2000, with 113 companies and over 10% of the total market cap. For most of the 2000s, several companies each year reported a P/S ratio over 25, making up a small but not insignificant portion of the total market cap.
The COVID-19 era of 2019-2023 saw another surge in high P/S ratios. In 2020, there were 32 companies with P/S ratios over 25, making up 1.10% of the total market cap. The trend extended into 2021 when 44 companies contributed to 2.46% of the total market cap. This shift was partly propelled by an influx of high-profile initial public offerings (IPOs), as newly public companies often command high valuations. The momentum shows no signs of waning in 2023, with over a dozen companies already boasting a 25 P/S in Q1 alone—the majority of which are tech stocks.
Dynamics of top P/S stocks
Within the universe of the top 500 largest US companies by market capitalisation, 99 companies have reached the distinction of having the highest P/S ratio of all companies since the 1960s. Nvidia now holds this title today.
The Tech sector takes the lion’s share of the highest multiple stocks, representing 27.3% of the companies, followed by the Health and Energy sectors, accounting for 22.2% and 17.2% respectively. To understand the dynamics of the companies with the top P/S ratio, we examined their performance over various periods following the point at which they claimed the top spot. We scrutinised their returns over the subsequent 1, 3, 5-year periods, and until the end of sample or March 2023.
Figure 3: Subsequent performance after companies reach top P/S for the first time
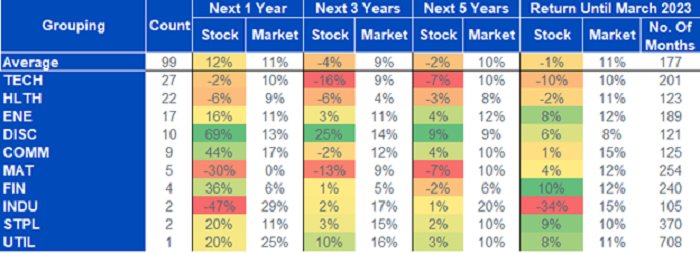
Source: Research conducted for ‘Stocks for the Long Run 6th Edition’, Jeremy Siegel with Jeremy Schwartz (2022).
Historical performance is not an indication of future performance and any investments may go down in value.
An interesting pattern emerged. In the year following the point when a stock takes the top spot for the P/S ratio for the first time, these companies continued outperforming—on average beating the S&P 500 by almost 1.5%.
But their momentum falters in the years that follow; within the next three years, their average annual return declines to -4.4%, and the five-year average annual return fell further to -1.5%. Notably, the markets were annualising over 9% over those next 3-5 years, so their under-performance versus the market was more than double digits. When we take the entire history of these stocks, their average return still falls short of the market by over 12% a year.
Even when we break it down by sector, it seems as though once a company reaches the position of ‘top P/S’, it struggles to maintain its momentum and keep up with the market. Tech and Health sectors, those with the most companies appearing in this top spot, don’t even outperform in the short term, but have negative returns on average.
Declining odds of out-performance
Looking at all 2691 companies that have been in the largest 500 at some point, the tables below show how frequently companies reach a specific P/S threshold, and the odds that it will outperform the market in the next 1,3,5,10, and 20 years.
Figure 4a: Probability that stocks outperform the market at higher valuations
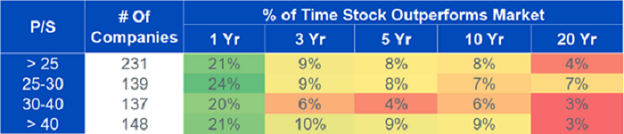
Source: Research conducted for ‘Stocks for the Long Run 6th Edition’, Jeremy Siegel with Jeremy Schwartz (2022).
Historical performance is not an indication of future performance and any investments may go down in value.
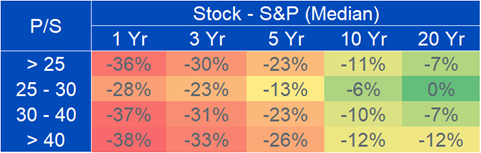
Figure 4b: Median relative performance of stocks at higher valuations
Source: Research conducted for ‘Stocks for the Long Run 6th Edition’, Jeremy Siegel with Jeremy Schwartz (2022).
Historical performance is not an indication of future performance and any investments may go down in value.
For the 231 companies that have reached a P/S over 25, they only outperformed the market in the next year 21% of the time, with a median relative return of -36%. Over longer horizons, this percentage worsens, reaching 9% over the next 3 years, and 4% over the next 20 years. For higher P/S ratios (>40) it’s even less likely to outperform the market on all time frames. The odds become stacked against you having a winning long-term stock at these valuations.
The market has seen a shift in recent years, with high price-to-sales (P/S) ratios becoming increasingly common, particularly in the Tech sector. Our analysis suggests that an overemphasis on high P/S stocks may falter in the long run, as it may prove difficult for these companies to sustain the rapid growth required to justify these valuations and continue their performance trajectory.
Sources
1 Source: Performance data is referenced from Yahoo Finance, with YTD referring to 2023 through 21 July 2023.
2 Source: Respective S&P 500 Index and Nasdaq 100 Index factsheets, with current data as of 30 June 2023.
3 Source: https://investor.nvidia.com/news/press-release-details/2023/NVIDIA-Announces-Financial-Results-for-First-Quarter-Fiscal-2024/default.aspx
—
Originally Posted August 3, 2023 – Performance after peak valuation: navigating the tech sector’s high multiples
Disclosure: WisdomTree Europe
This material is prepared by WisdomTree and its affiliates and is not intended to be relied upon as a forecast, research or investment advice, and is not a recommendation, offer or solicitation to buy or sell any securities or to adopt any investment strategy. The opinions expressed are as of the date of production and may change as subsequent conditions vary. The information and opinions contained in this material are derived from proprietary and non-proprietary sources. As such, no warranty of accuracy or reliability is given and no responsibility arising in any other way for errors and omissions (including responsibility to any person by reason of negligence) is accepted by WisdomTree, nor any affiliate, nor any of their officers, employees or agents. Reliance upon information in this material is at the sole discretion of the reader. Past performance is not a reliable indicator of future performance.
Please click here for our full disclaimer.
Jurisdictions in the European Economic Area (“EEA”): This content has been provided by WisdomTree Ireland Limited, which is authorised and regulated by the Central Bank of Ireland.
Jurisdictions outside of the EEA: This content has been provided by WisdomTree UK Limited, which is authorised and regulated by the United Kingdom Financial Conduct Authority.
Disclosure: Interactive Brokers
Information posted on IBKR Campus that is provided by third-parties does NOT constitute a recommendation that you should contract for the services of that third party. Third-party participants who contribute to IBKR Campus are independent of Interactive Brokers and Interactive Brokers does not make any representations or warranties concerning the services offered, their past or future performance, or the accuracy of the information provided by the third party. Past performance is no guarantee of future results.
This material is from WisdomTree Europe and is being posted with its permission. The views expressed in this material are solely those of the author and/or WisdomTree Europe and Interactive Brokers is not endorsing or recommending any investment or trading discussed in the material. This material is not and should not be construed as an offer to buy or sell any security. It should not be construed as research or investment advice or a recommendation to buy, sell or hold any security or commodity. This material does not and is not intended to take into account the particular financial conditions, investment objectives or requirements of individual customers. Before acting on this material, you should consider whether it is suitable for your particular circumstances and, as necessary, seek professional advice.


")

Join The Conversation
If you have a general question, it may already be covered in our FAQs. If you have an account-specific question or concern, please reach out to Client Services.