


It’s amazing how quickly we become accustomed to good news. I have probably received more questions in the past two days about why stocks have been selling off than I did about why they were rallying during the past few weeks.
Let’s be clear – I had plenty of discussions about the character and leadership of the recent rally, but the idea that stocks should go up went largely unquestioned. When we’ve rallied for 6-8 straight weeks (six for the S&P 500 [SPX] and eight for the NASDAQ 100 [NDX]) it becomes second nature to think that the uptrend is simply the expected state of affairs. To a large extent, that is a reasonable expectation. Stocks do tend to go up over time, which is a key rationale for equity investing. But it is not normal for any asset class to rise unrelentingly.
That is why my comments over the past couple of days have tended to start with a reminder that there is nothing abnormal or unhealthy about some profit taking after a strong move higher. Traders know that even in a highly trending market it is typical for prices to experience some countertrend moves; “backing and filling” is one term that applies.
It is also important to put the “sell off” into perspective. Even at today’s lows we had only given back last week’s post-FOMC rally. Yes, we’re back to levels not seen since less than a week ago, as the following graph shows:
6-Day Chart, SPX (red/green 5-minute bars), NDX (blue line)
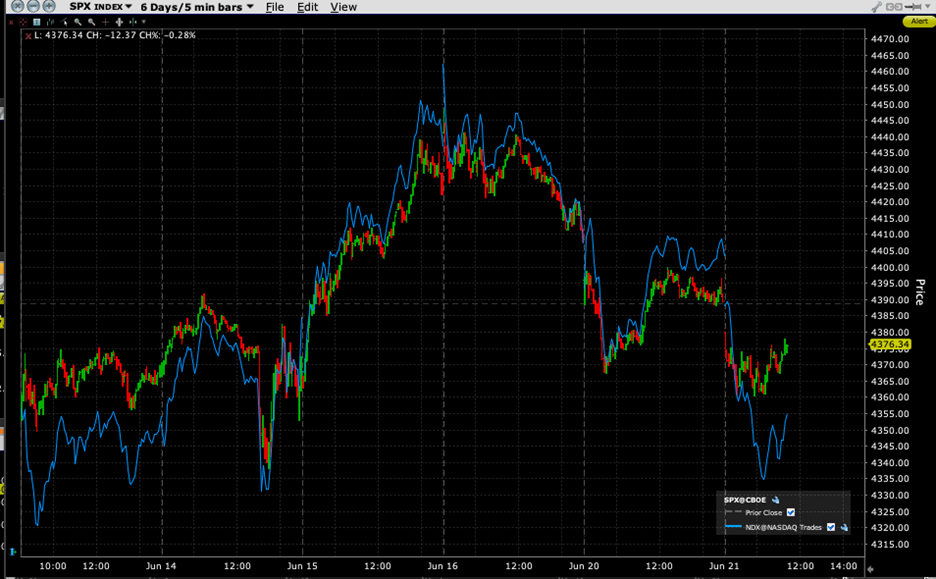
Source: Interactive Brokers
When we look back to early May, we see just how modest the current pullback is – especially in the case of NDX:
32-Day Chart (since May 5th), SPX (red/green hourly bars), NDX (blue line)
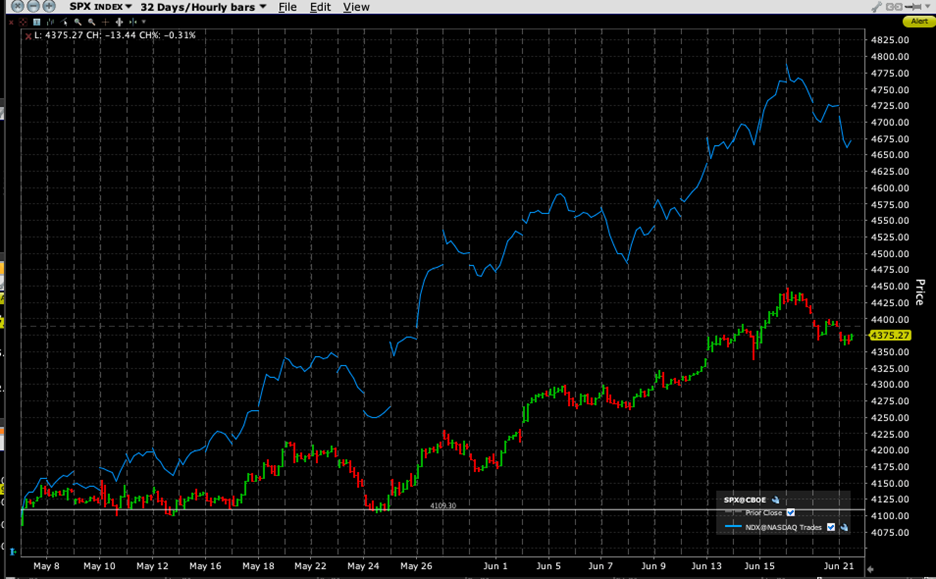
Source: Interactive Brokers
When we see how far NDX has run in a short period of time – roughly 17% in about six weeks – it should be unsurprising that the magnitude of the pullback in that index is relatively larger. Simply put, there are more profits to take.
In yesterday’s piece we attempted to reconcile the divergent viewpoints of the stock and bond markets. Simply put, stock investors are inherently optimistic, thinking about potential upside gains; bond investors are inherently pessimistic, necessarily concerned about the factors that could interfere with receiving their promised payouts. While stocks were running higher, bond yields rose too (prices falling). The 2-year yield rose by about a full percentage point while the 10-year yield rose by about half that. The key inversion of those two rates has increased to just under a full percentage point, which indicates that the bond market fears an impending recession. Stocks of course are far less fearful. What we are seeing over the past few days is the market’s attempt to reconcile that divergence.
It might also be possible that we have fully incorporated the unintended monetary surge that occurred when the Fed intervened in the banking crisis. Their balance sheet expanded by $300 billion, which likely spurred some of the recent advance. We discussed the asymmetric response of markets to liquidity increases – which are reflected quickly – versus liquidity decreases that operate with a long and variable lag. Now we are back to seeing balance sheet shrinkage once again.
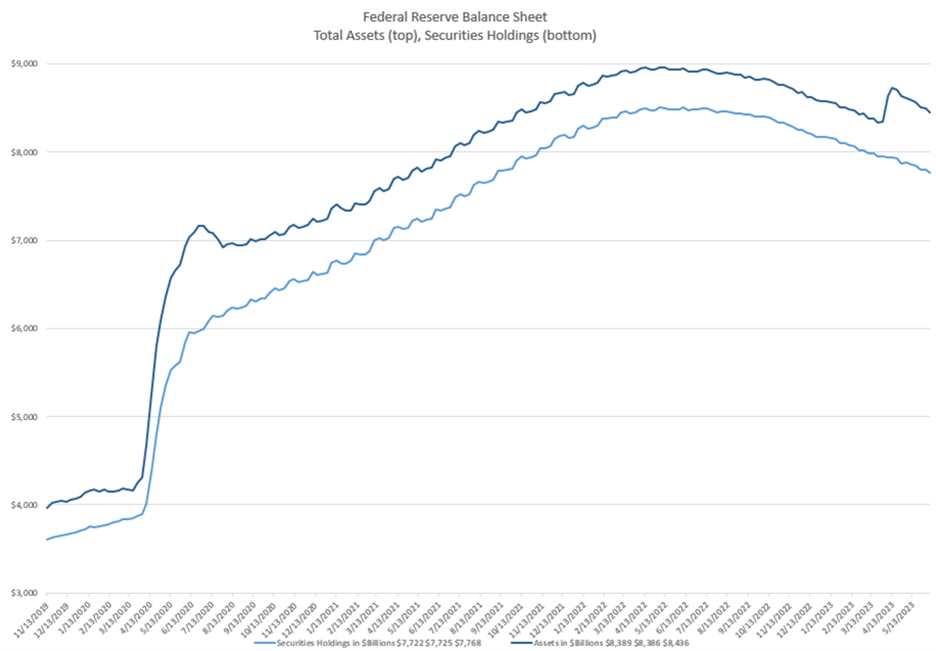
Source: Federal Reserve H.4.1 reports, Interactive Brokers
Finally, I believe that it is no coincidence that the most recent leg higher occurred as we approached a quarterly expiration. Furthermore, it is probably no coincidence that Friday’s expiration was a bit of a dud. Once the AM expiring options were off the board, so was a major catalyst to the rally. While many market observers have rightfully become more focused on short-term options trading, major expirations still matter.
Could this current minor selloff metastasize into something more significant? Sure. Trend changes often start slowly and imperceptibly. The current level of VIX – 13.42 – certainly tells us that there is little demand for hedging protection from institutions. Unfortunately, VIX can often be a contrarian indicator too.
Vigilance is always a requirement of successful investing and trading. It is easy to forget that when stocks are rising. As of now, the recent declines should not be concerning, but they should also not be ignored.
Join The Conversation
If you have a general question, it may already be covered in our FAQs. If you have an account-specific question or concern, please reach out to Client Services.
Leave a Reply
Disclosure: Interactive Brokers
The analysis in this material is provided for information only and is not and should not be construed as an offer to sell or the solicitation of an offer to buy any security. To the extent that this material discusses general market activity, industry or sector trends or other broad-based economic or political conditions, it should not be construed as research or investment advice. To the extent that it includes references to specific securities, commodities, currencies, or other instruments, those references do not constitute a recommendation by IBKR to buy, sell or hold such investments. This material does not and is not intended to take into account the particular financial conditions, investment objectives or requirements of individual customers. Before acting on this material, you should consider whether it is suitable for your particular circumstances and, as necessary, seek professional advice.
The views and opinions expressed herein are those of the author and do not necessarily reflect the views of Interactive Brokers, its affiliates, or its employees.
Disclosure: Options Trading
Options involve risk and are not suitable for all investors. Multiple leg strategies, including spreads, will incur multiple commission charges. For more information read the "Characteristics and Risks of Standardized Options" also known as the options disclosure document (ODD) or visit ibkr.com/occ


Nice description of current market status
Thank you for the compliment, George. We hope you’ll continue to follow Traders’ Insight.