


Study Notes:
The Economic Insight area enables the user to gauge the impact on currencies from economic calendar events. The page allows users to filter their search by country and currency, determine the relative importance of calendar events and view a summary of observed or past volatility in the four hours following the release of the data point. Finally, Trading Central creates a series of visuals that helps depict the impact of the data point over time using Event, Price, Volatility and Impact charts that enable the user to draw conclusions about how data impacts markets when it’s in line, strong or weak versus consensus. Let’s look at the page layout.
The default page layout shows all economic events for all countries. Column headers show Time, Country and Event. Economic events are assigned rankings of low, medium and high and displayed under the Importance header. Economic events are displayed in date order and so the Forecast Values should always populate while Actual values will only populate upon data release. This enables the user to see whether the report outcome was hotter or cooler than forecast.
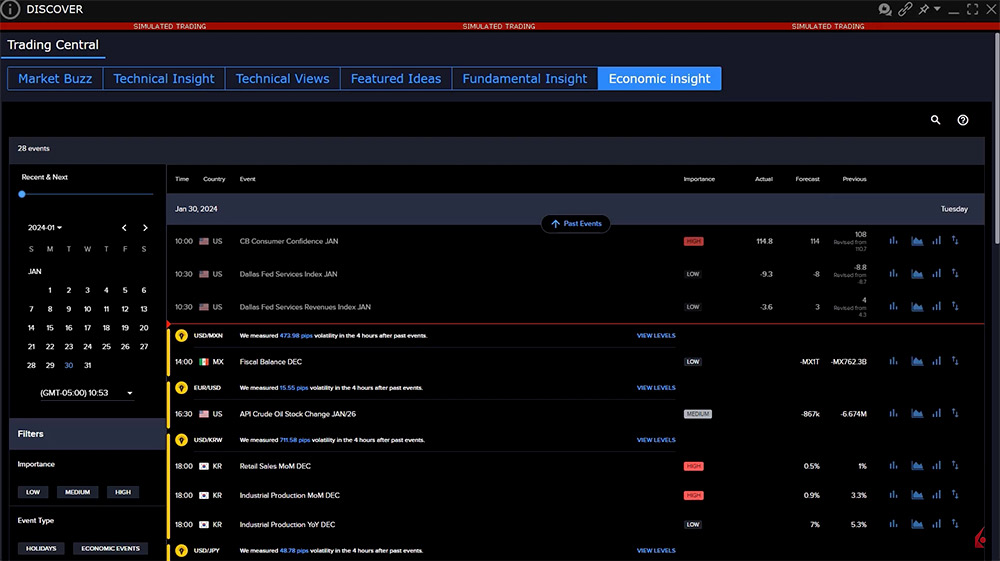
To the far right of the page are four icons. Hover above to see Event, Price, Volatility and Impact. Clicking an icon will display a chart. We will return to these shortly.
Notice the country flag alongside each data release. The data release is linked to the volatility of that country’s exchange rate, typically, but not always against the US dollar. The yellow icon draws the user’s attention to a currency pair and measures observed volatility in the noted currency pair over a defined period following the data release. Clicking the number of pips or basis points in the highlight line will open the impact and event charts.
Let’s look at how to filter on the left panel to isolate only key economic data for the United States. Beneath the calendar is a set of filters. In this example, as we want to examine the impact on the US dollar, user clicks on the High icon. Under Event type, user clicks on Economic Events. Under Countries, user expands the G7 list and selects United States. The display now shows only key economic data in date order for the US. In this example, the user wants to see the impact on the dollar from the nonfarm payrolls report, which is released on the first Friday monthly. Locate and click on the event. Click Read More for a deeper explanation if you wish on the report itself. Click on any of the Chart icons to the right to open the analytical display.
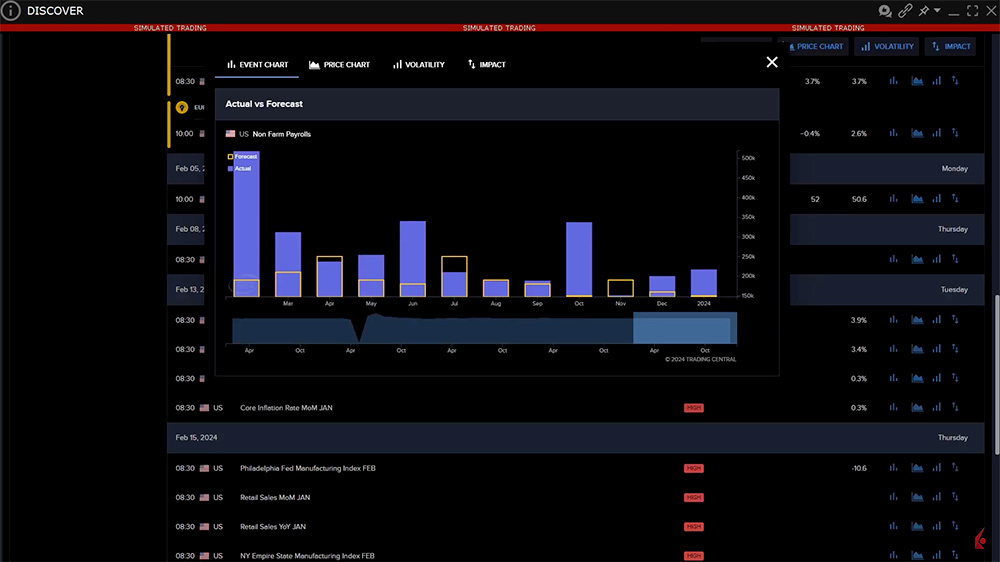
Event Chart
Using the Event Chart display user can easily compare how the data turn out versus survey consensus. The Forecast data displays in yellow versus the actual data point in blue. In general, the number of jobs created in this example has typically exceeded expectations, which might benefit the US dollar.
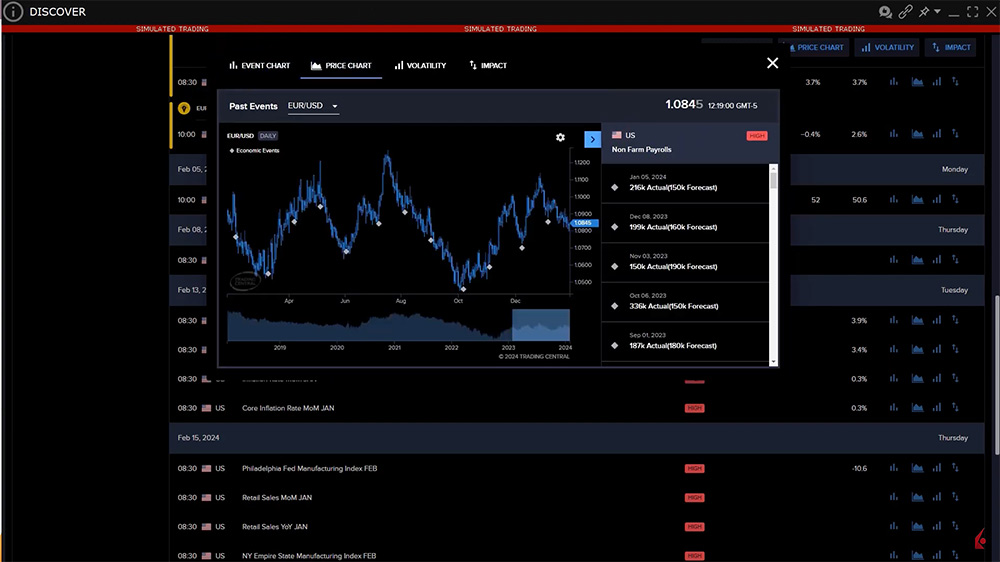
Price Chart
The price chart labels the day on which the data was released and to the right the user may select prior monthly readings. Click a different month to recenter the chart around that month’s report. Click the right arrow to eliminate the monthly data and maximize the price display. The chart displays the price of the selected currency pair, in this case Euro/Dollar. This may be changed by the user at the top of the chart by clicking and selecting the dollar against another currency major.
Volatility
Click on the Volatility tab to view summary data for:
- Currency pair selected
- Time period following the event
- Impact relative to forecast – i.e. above, below or in line data
- Summary of volatility and direction of price following the data release
- Percentage of bullish events
- Percentage of bearish events
- True Range of the currency pair and a 12-month average True Range
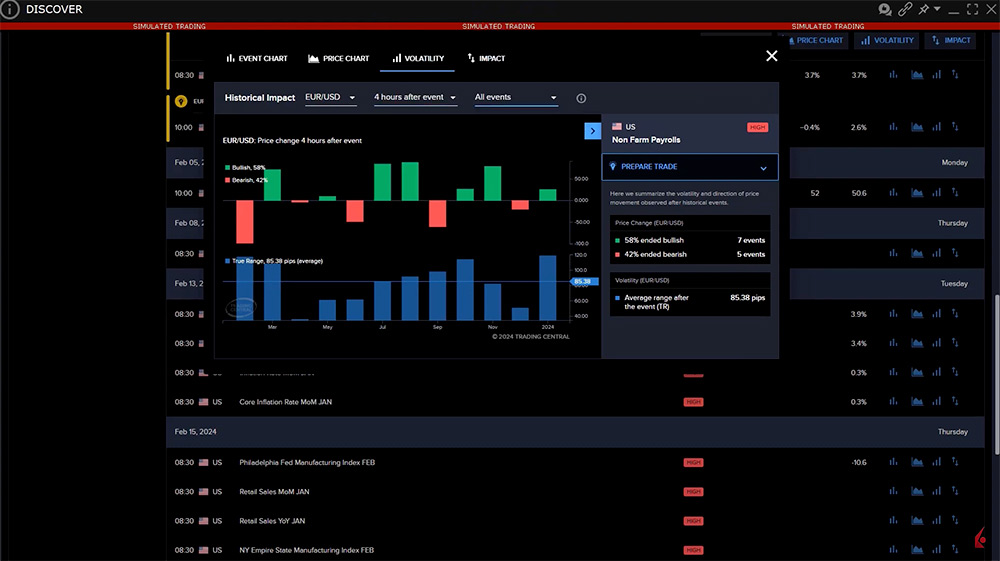
This information can help the user in their analysis of how the currency might react in response to hotter or cooler employment data. The user may be able to project intraday price objectives in the knowledge that the dollar rises in value when the nonfarm payroll reading falls short of expectations. Or they may be able to determine whether the intraday range will increase following the initial 30-minute response window.
Impact Window
The Impact window puts the currency effect under a five-minute microscope and the user may examine the price movement through the lens of different time periods following its release. Select from 15 minutes, 30 minutes, one hour and four hours.
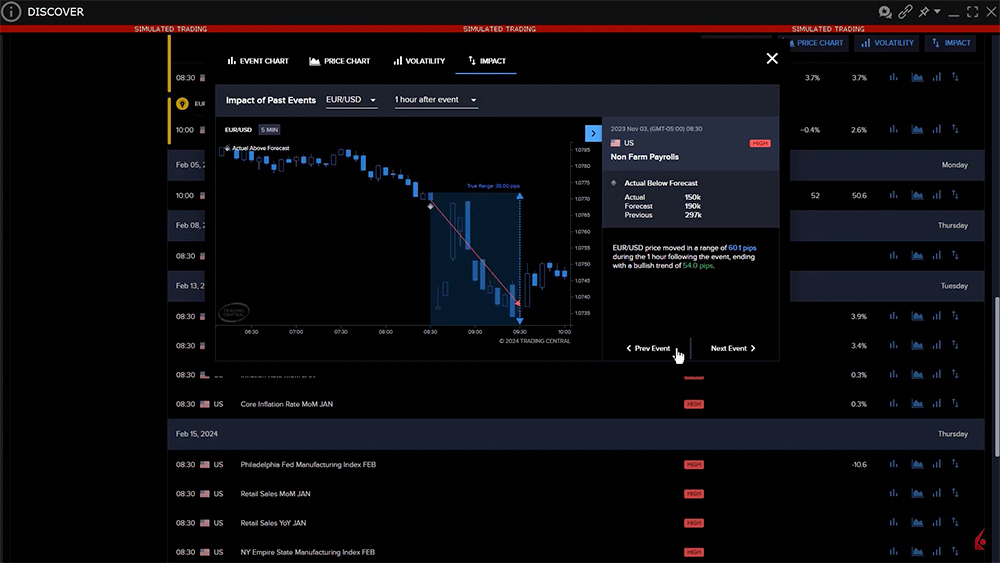
First, user selects the historic data point to view. Use the Previous Event/ Next Event buttons to move between reports. The data out turn is summarized to the right and the key shows the moment of the data release. The summary to the right explains the price range over the selected timeframe and where the currency closed at the end of the period. Investors can use the information to observe the impact of strong and weaker than anticipated data over time to visualize whether the immediate reaction is more likely or not to continue its initial move. Use the impact on alternative currency pairs to learn which currency relationship has more or less relative impact or which currency might change direction first.
Summary
The Trading Central Economic Insight tool offers traders a solid dictionary of historical impact on currency volatility. Use the tool to examine the impact of strong and weak data reports on currency pairs during the key intraday period. Knowing what has happened historically can teach the investor how to respond to data as it rolls in.
Resources
Join The Conversation
If you have a general question, it may already be covered in our FAQs. If you have an account-specific question or concern, please reach out to Client Services.