


Study Notes:
The Technical Insight section educates users about commonly occurring types of patterns associated with the discipline known as technical analysis. Using pattern recognition technology, the software makes the investor’s job easier by identifying technical set-ups and patterns allowing the user to review and determine whether they might act upon a potential trigger.
There are four sections to the Technical Insight area.
- Homepage
- Screener
- Watchlist
- Alert Center
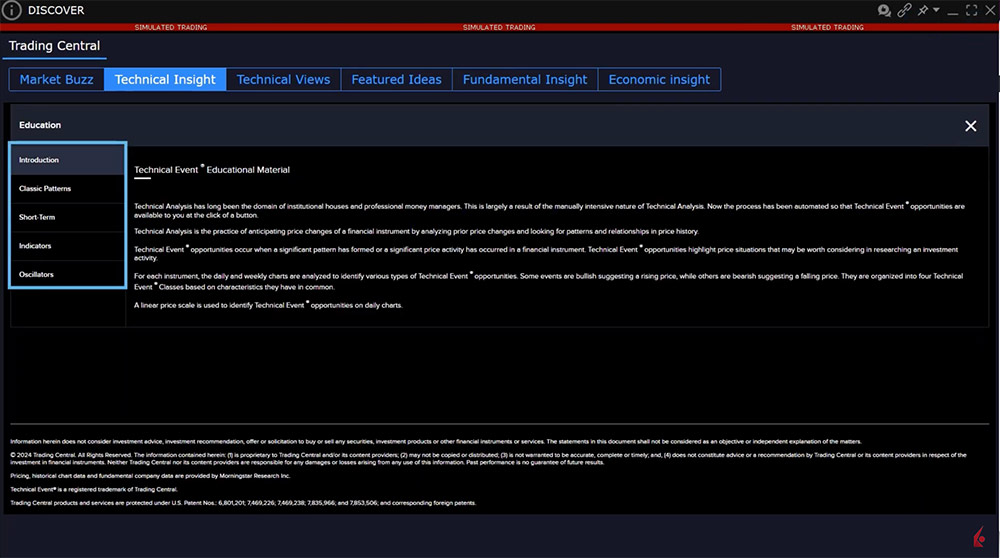
To the right corner of the page are three icons. A magnifying glass for searching symbols; an education area and a help icon. Before we describe each of the four pages, let’s take a look at the Education area by clicking on the Mortar Board cap icon.
Education
To the left is a menu with a brief introduction about the Technical Event section of the software, how the analysis works and how opportunities are displayed in charts.
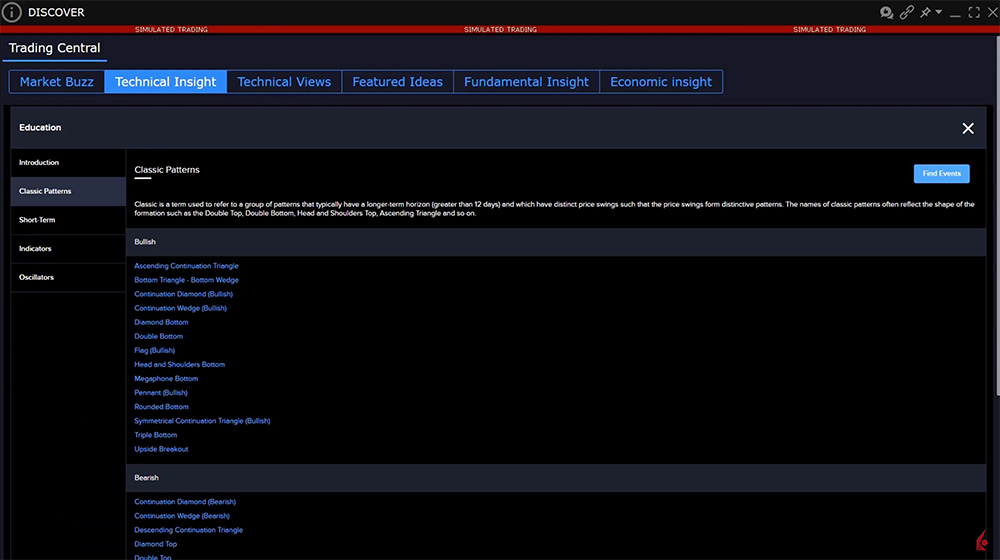
Expand the Classic Patterns tab to reveal hyperlinks to patterns divided into Bullish and Bearish type. Clicking through any of the terms reveals a standardized description of what the pattern is, how to define it and its development. Watch the animation to see the pattern evolve over time. Users can learn all about the important characteristics of a specific pattern, what length of time they may develop over, conditions that validate or refute and potential price targets resulting from the triggering of a pattern.
The Short-Term tab shows a different set of patterns that typically unfold quickly over a period of hours or days. Click through any to learn about the pattern’s evolution and characteristics.
Under the Indicators tab, users may investigate several supported patterns built upon moving average behaviors.
The Oscillators tab contains bullish or bearish studies using historical price data to build mathematical formulas intended to measure the strength of a trend. Click through any to learn more about the use of a particular oscillator. Use the X icon to the upper right to return to the Technical Insight homepage.
Homepage
At the top of the homepage user will see charts for stocks they most recently viewed. Beneath are four separate areas depicting charts categorized as:
- Most Viewed Bullish
- Most Popular
- Trending Now
- Most Viewed Bearish
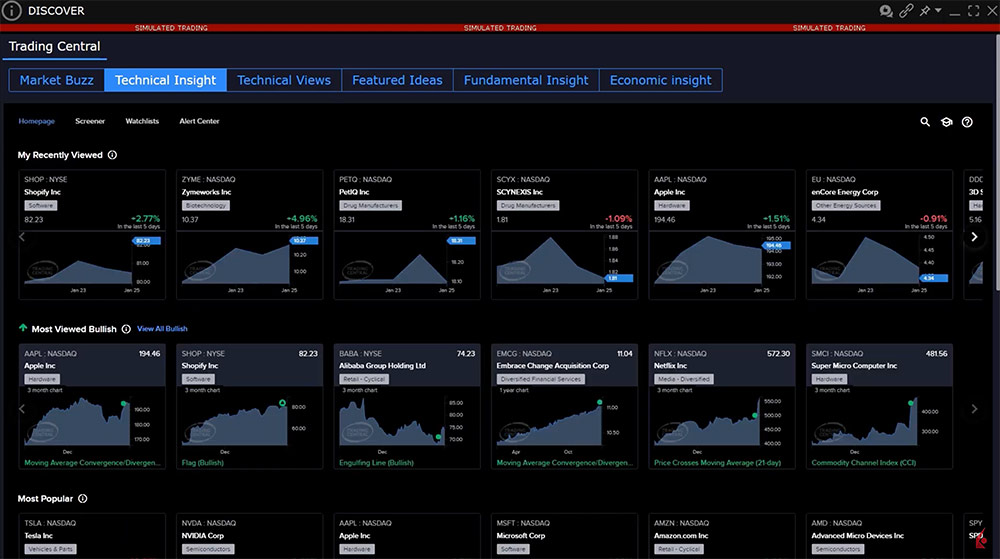
Hovering over the information icon to the right of Most Viewed Bullish explains that the charts appear because they contain the highest count of bullish events in the past week. Beneath each chart is a description for the latest pattern to develop. Click through a chart to display a bigger technical narrative including where the stock trades and to which sector it belongs. Below its trading price the Technical Insight offers a Summary of the number of technical events along with a Short-term, Intermediate-term and Long-term interpretation of the technical data. Using a four-point number scale below, the software measures how relatively bullish or bearish the picture is.
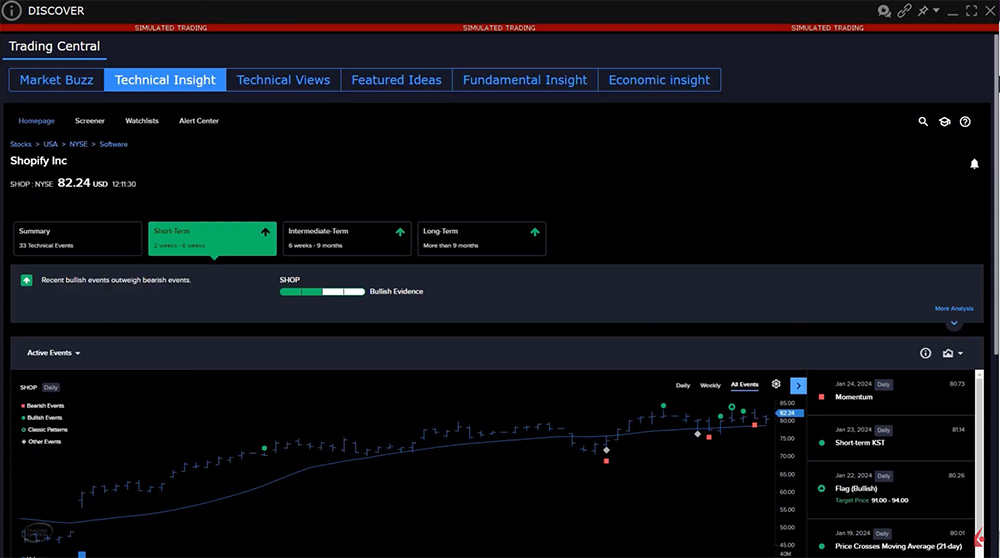
Beneath is a price chart with volume and oscillators plotted below. The display is configurable from the Settings icon to the upper right. Choose the price display from price bar, candlestick, line or mountain view. Click the Oscillator button to select additional momentum studies to the plot. Note that users may also choose between daily and weekly chart display and that different patterns may appear under each timeframe. Use the sliding blue scale below the plot to magnify in and out from the chart.
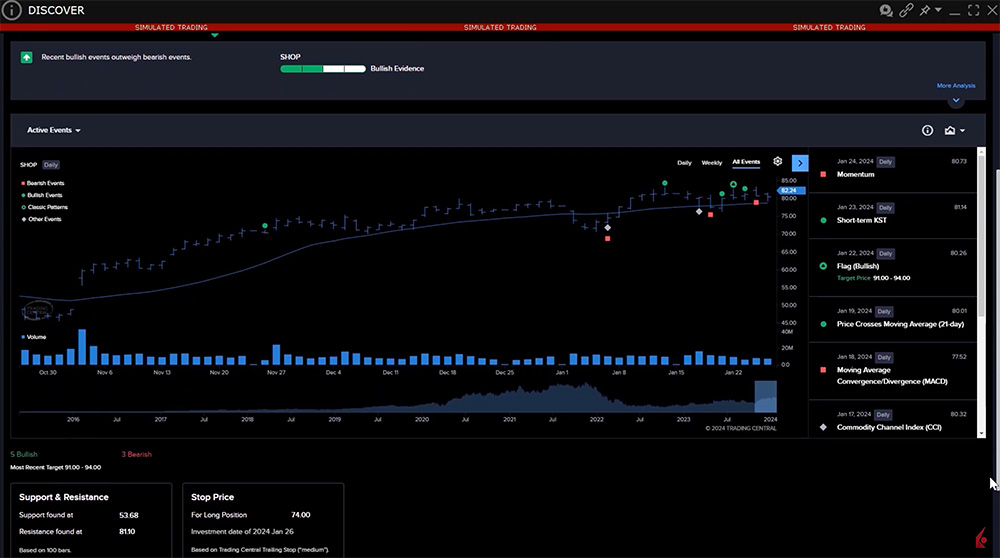
The chart is annotated to display which pattern or technical event happened on which trading day. Each event is displayed in list format to the right of the chart in descending date order. The user may hover above any green or red symbol on the plot to identify each event. This is displayed to the upper left corner of the plot. Click on any event to isolate its occurrence in the right display. Click on the event to see an expanded view. Click the Learn More hyperlink for greater detail. Use the X button to close and locate and click the Active Events icon in the upper left to return to the chart display.
At the bottom of the chart is a summary of technical support and resistance price points. Depending upon the balance of recent bullish and bearish patterns and signals generated, the final box suggests a Stop Price for a long or short position along with investment date.
Screener
The Screener allows the user to filter assets by specific fundamental information (such as market cap and trading volume for stocks) to locate those exhibiting specific pattern characteristics on an intraday, daily or weekly basis. Screeners can filter across stocks & ETFs, indexes, forex and futures.
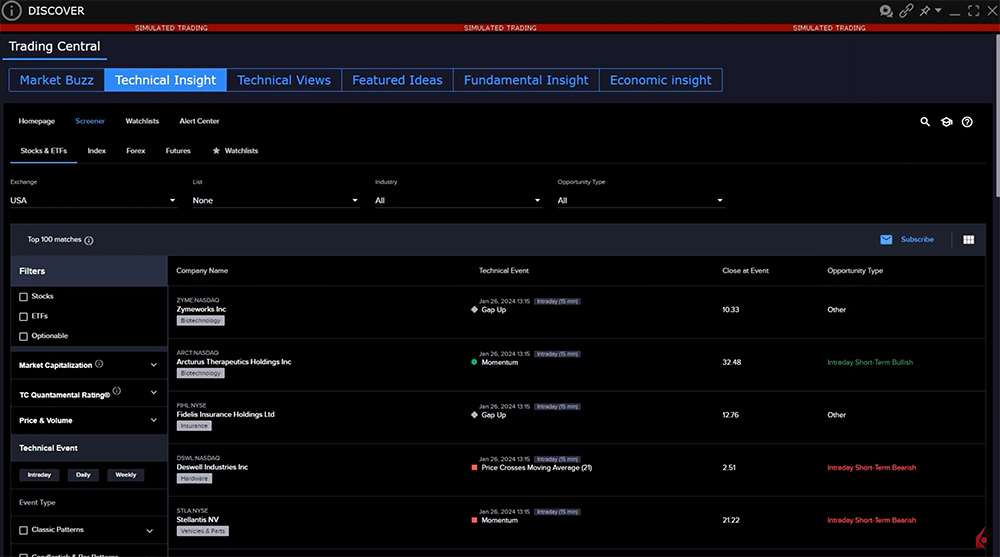
There are two types of filters. The display differs between asset type, but using stocks & ETFs, user may select from regional exchanges, select stocks that meet certain index or theme type from the list dropdown menu, select from an industry or opportunity type, such as bullish or bearish.
Along the left side of the screener, users may determine whether to filter by stocks, ETFs or optionable stocks only. Market cap can be filtered by large, midcap or small cap. The TC Quantamental Rating is proprietary to Trading Central, but rates 50,000 stocks worldwide on a 0-100 rating. Hover above the information icon for a full description. Use the sliders to include and exclude stocks within a specified range. Enter thresholds for minimum and maximum price and volume if necessary. Next, choose a timeframe from intraday, daily or weekly by clicking on a button. Then use the Event type to determine which patterns, indicators and oscillators to search for. Check a box to include all studies or click a dropdown to drill into patterns by grouping. User may also determine a minimum or maximum expected percentage price move should they wish.
The scanner outputs results as the inputs are adjusted (there is no Search button to click). The results are displayed in table format to the right, but maybe displayed in grid view with accompanying chart on display. Change the display using the grid icon to the upper right of the scanner. Click any line or chart to drill down into the specific analysis for the individual stock. Use the chart histogram icon above the event panel (upper right) to see the stock’s chart or recent signals displayed individually. Click the Learn More hyperlink to expand the explanation.
Click Screener to the upper left to return to the screener. To save your inputs, click the Subscribe icon to the upper right of the results display and name your screener. Subscribed screens are displayed inside the Alert Center.
Resources
Join The Conversation
If you have a general question, it may already be covered in our FAQs. If you have an account-specific question or concern, please reach out to Client Services.