


Study Notes:
The IBKR Securities Lending Dashboard provides critical short selling metrics powered by third-party data provider Orbisa and is available within TWS and Client Portal. While several data components are available for free, a premium subscription is required to see the full suite of available data points. For the sake of completeness, this video lesson will display content available to subscribers.
The Securities Lending Dashboard provides data and analysis for US stocks and ETFs.
Within TWS, click the symbol you want to review Securities Lending data for and then from the New Window button, locate and click on Fundamentals Explorer. Within the pop-up window navigate across the top menu to locate and click on Securities Lending to the right of Short Selling.
Let’s break down the display into its broad parts.
Maximum of four lending metrics are displayed across the upper section for a specified timeframe. The boxes provide a “snapshot” for the selected ticker. The trend lines in each box turn different colors according to the trend during the specified time period. Green for upward-sloping, red for down-ward sloping and blue for unchanged.
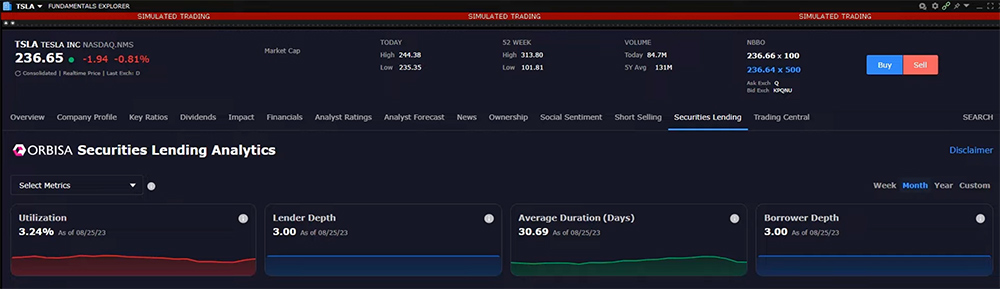
Use the Select Metrics dropdown menu to the upper left of the plots to determine which four are shown. Use the timeframe selector to the upper right to determine the period on display. The available metrics are:
- Average Duration
- Borrower Depth
- Days to Cover
- Lender Depth
- On Loan Quantity
- On Loan Value
- Short Interest Indicator
- Utilization
Because users may only select four items at once, deselect the fourth checkbox before checking any other checkbox, and then click the Apply button to close the selector and complete the display. Notice in the upper right of each plot is a grey circular information icon. Hover above the information icon for definition of each metric. The user may get a better sense of the recent reading by expanding the timeframe displayed in order to get a relative sense of whether one metric is high or low historically.
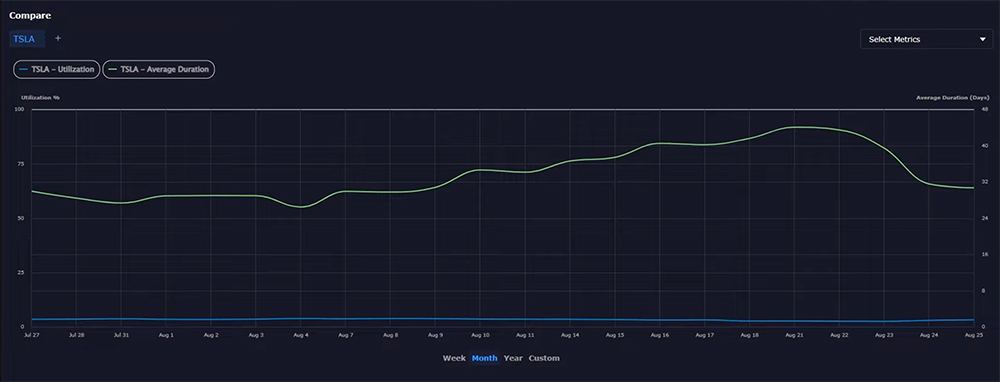
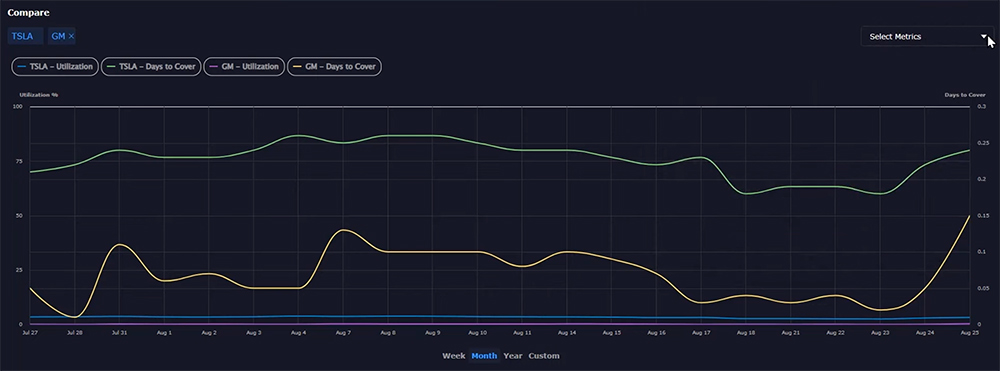
The Compare chart allows users to see up to two selected metrics for one or two ticker symbols at a time. To change the selected company, enter the required symbol in the upper left of the Fundamentals Explorer and make the desired selection, or choose from the dropdown list of recently searched symbols. For the chosen symbol the user may choose two items from the Select Metrics drop down menu to the right of the chart. Once again, deselect one in order to add another and click the Apply button. The chart reflects the values for the selected metrics. Each metric displayed maybe turned on or off by clicking the label below the symbol in order to isolate one of the metrics. Change the timeframe for the display by clicking on Week, Month, Year or Timeframe to select an alternative period for analysis.
To add a competitor or any other symbol, click the plus button to the right of the prevailing ticker directly beneath the Compare header above and to the left of the chart. This opens a Search bar into which users input a second ticker symbol. The chart will populate with lines for each metric and for each symbol helping users compare which symbol has higher demand, or which might be more or less prone to a short squeeze under certain circumstances. For more information, select alternative metrics to build a bigger picture.
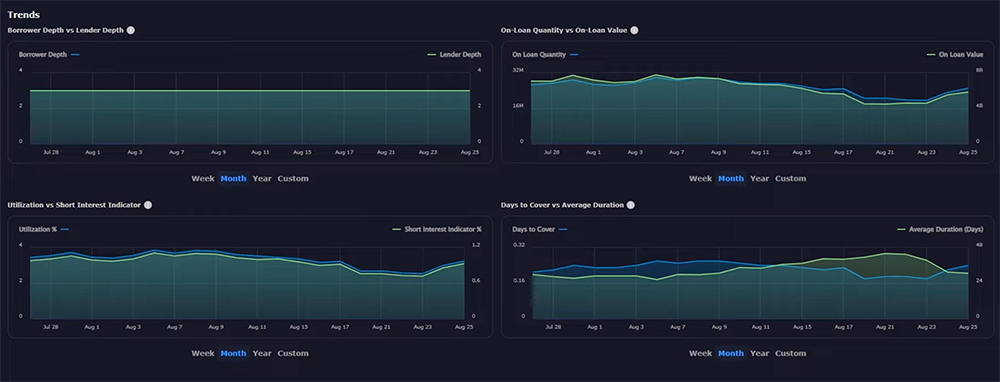
The Trends portion of the page displays the eight available metrics in a logical format to depict trends for the primary ticker selected. Because all eight metrics are in play at the same time, the user cannot change the display but can change the time period shown by selecting the desired range below each of the four charts.
To the upper left is shown Borrower Depth versus Lender Depth.
Hover above the information icon to display an expanded definition with examples.
Each series is color-coded and clearly displayed above the left and right axis.
To its right is a plot for On-Loan Quantity versus On-Loan Value. Note the values on left and right axis may differ. Use the mouse to hover over the chart to display values for each series.
On the second row, the left chart displays Utilization, a measure of demand, versus Short interest Indicator. Both values here are expressed in percentage terms but use different scales on left and right of the plot. The final chart displays Days to Cover versus Average Duration.
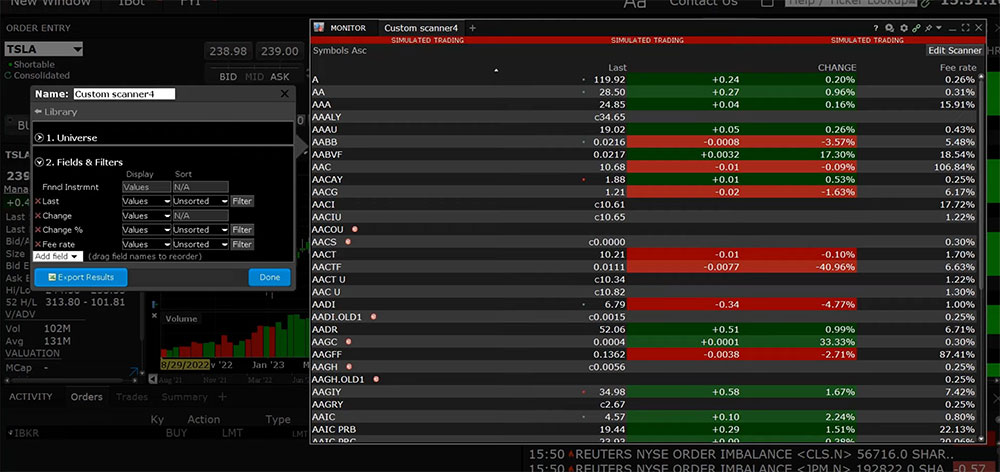
The Mosaic Market Scanner can be used to identify hard-to-borrow stocks according to the user’s criteria such as the borrow fee, Utilization, market cap and country. The user can then analyze what is happening in the securities lending market for the resulting tickers by using the Securities Lending dashboard.
Resources:
TWS User Guide – Orbisa Securities Lending Dashboard
Join The Conversation
If you have a general question, it may already be covered in our FAQs. If you have an account-specific question or concern, please reach out to Client Services.