


Study Notes:
Option pricing is affected by several factors including the price of the underlying, interest rates, and volatility. Volatility is a metric for the speed and movement of the underlying asset and with all things being equal such as strike price & underlying price the higher the volatility the higher the price of the option. In this lesson we will go over the Trader Workstation Volatility Lab tools to analyze volatility and how to enter an order using order types designed to trade options according to volatility levels.
Volatility Lab
Let us start by bringing up the Volatility Lab. Click on the New Window button to the upper left of Mosaic and scroll down to the Option Tools section. Select Advanced Option Tools and then Volatility Lab. The Volatility Lab will populate with the active ticker. You may change the symbol by clicking on the drop-down menu in the upper left-hand corner on any of the tiles
The Volatility Lab consists of 3 separate tabs offering tools to analyze Implied Volatility, Historical Volatility, and by Industry comparison. The tabs contain similar tools but with different settings to give the user a variety of data in one area.
Let’s walk through each tab.
The Implied Volatility tab is comprised of 5 tools: they are Implied Volatility, Volatility Profile, Multi-Expiry Skew, Time lapse Skew, and Open Interest.
The Implied Volatility tool is located at the top left corner of the screen. This tool gives you a look back view of implied volatility for all available expirations for a ticker symbol.
Click on the plus sign next to Last Trading Days to select the expirations you want to view. Now select the time period, you can choose 1 week, 1, 2, or 6 months, 1 year or create a custom period.
Move the cursor in the chart over the day and you will see the implied volatility for each expiration for that day. Use this chart to view whether implied volatility was relatively high or low during any given past period. You can see the price of the underlying symbol in the background uses a grey scale.
Directly below Implied Volatility is the Volatility Profile tool.
The Volatility Profile tool shows the Implied and Historic volatility side by side. You can deselect either Implied Volatility or Historical Volatility by clicking on the box next to them. Click the gear icon to change the volatility period from annual to daily or use the profile to compare the Implied Volatility to Industry comparisons by changing to comparison mode. Once in comparison mode click on the plus sign on the left-hand side to select the companies you’d like to compare or enter a symbol of your choice.
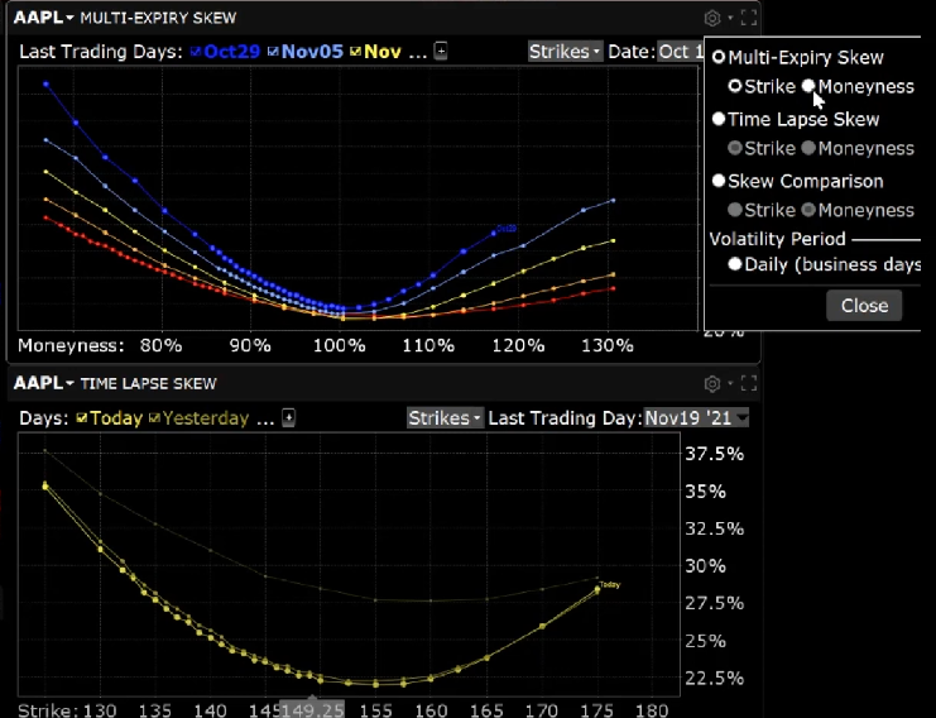
In the top right corner if the screen is the Multi-Expiry Skew viewer. This displays the premium paid for options at each expiration. Click the gear icon to choose between strike price or “Moneyness” which is the position of the strike in comparison to the underlying in the X-axis display. Choose which expirations by selecting the plus sign in the upper left-hand side next to “Last trading days”. You can select which date you would like to view as well as choose the range of strikes you want charted.
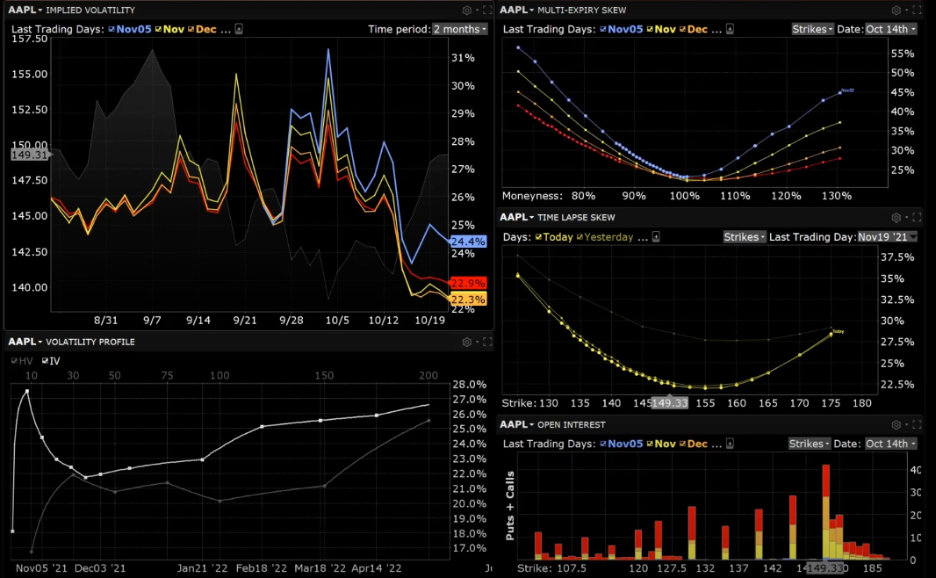
Next, we have the Time Lapse Skew tool.
Like the Multi Expiry Skew viewer the X axis can be adjusted to show either Strikes or Moneyness by going into the gear icon. This tool is helpful in charting how the price skew has evolved over a selected time period in order to possibly identify a catalyst that caused a skew to occur or disappear such as an earnings event or news story. Choose between several predefined periods or enter a customized date setting by clicking on the plus sign in the top left corner next to “Days”.
In the bottom right-hand corner is the Open Interest tool which, when clicking the gear icon, allows you to choose between open interest and option volume as well as view call and puts together or broken out into separate charts.
Choose which expiration you want to view by clicking on the plus sign in the top left corner and each will be assigned a color in the bar graph. Open interest and volume are helpful to see overall interest in an expiration and strike.
Now let’s look at the Historic Volatility tab by clicking on it at the bottom of the window.
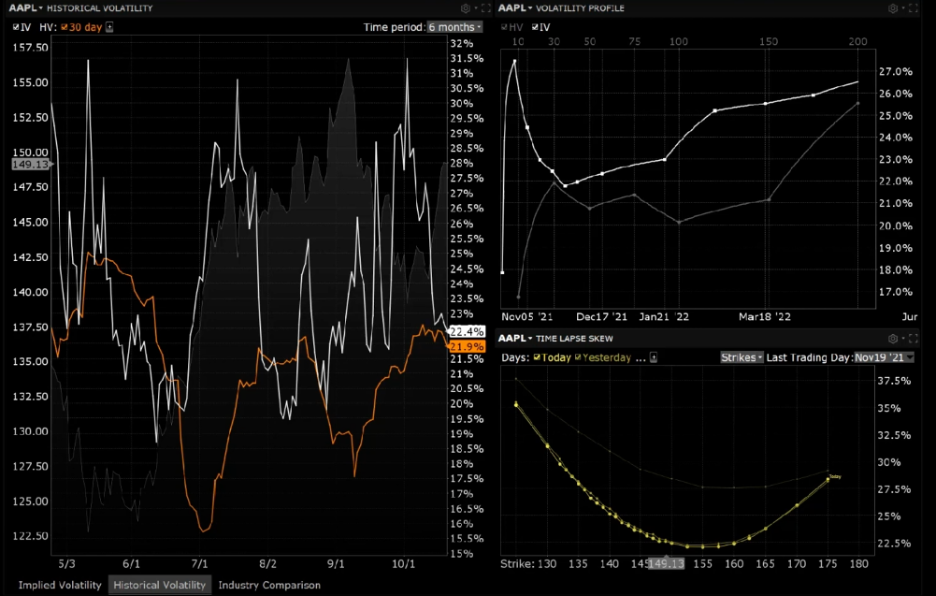
The Historical Volatility tab consists of 3 tools, Historical Volatility which is the same as Implied Volatility but set to show historical versus implied, the Volatility Profile tool, and the Time Lapse tool. Each tool can be adjusted as the user sees fit to get the desired time period and display.
The third tab is the Industry Comparison tab which consists of 5 tools: Custom Comps, Implied Volatility Comparison, Underlying Price tool, Skew Comparison, and the Volatility profile comparison.
The Custom Comps tool is preloaded with industry competitors, and you can add in any symbols you’d like. It allows you to compare the underlying price, implied and historic volatility as well as the ratio of the implied volatility over the historical volatility. Check the box next to each symbol to see it populate other tools within the layout.
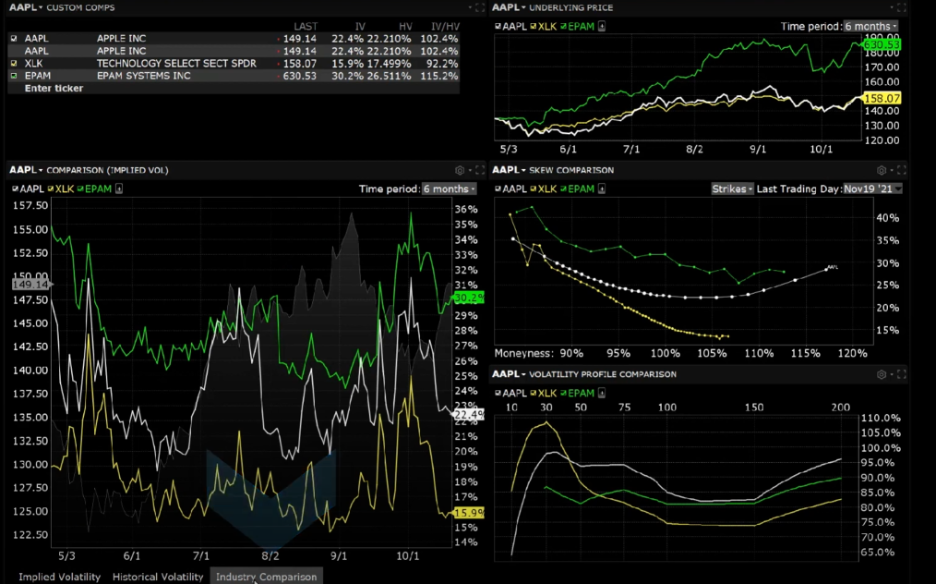
The Implied Volatility Comparison tool is the same viewer as the Implied and Historical previously discussed but with the settings set to Comparison mode. The chart displays the implied volatilities of all the competitors against the underlying you chose so that you can easily compare implied volatilities of each company and use it in your analysis.
In the top right-hand corner is the Underlying price tool. This displays each competitors’ ticker over time. Choose 1 Week, 1 month, 2 months, 6 months, a year, or choose custom entry.
The final two tools: the skew comparison and volatility profile comparison were discussed earlier in the lesson, instead of showing multiple expirations they show multiple underlyings so that you can further compare the group of stocks.
Volatility Trader
Now that we’ve gone over how to use the Volatility lab to research implied and historical volatility trends let us bring up the Volatility Trader by going into the New Window area, scrolling down to Advanced Option Tools, and clicking on Volatility Trader. Volatility Trader displays the bid and ask prices in volatility terms instead of premium. An option trader may want to tailor an order to trigger only if implied volatility is above or below a specific level.
Enter a symbol, select option and choose a strike and expiration.
The default order type is “Vol” for Volatility and once an order is created you can select either Annual or Daily to display the volatility of the order in the column labeled Vol Type. The volatility used to compute the limit price of the order is displayed in the Volatility column and can be adjusted to change the limit price. You may also adjust the limit price and see the change to volatility.
Underneath the volatility column, let’s increase the volatility and see how it effects the Limit price. Now we will lower the volatility and the limit price will lower.
Let’s enter a buy order with a limit price below the bid by setting the Volatility level lower than the bid and hit transmit. The order confirmation screen displays the order in volatility terms and hit transmit to make the order active.
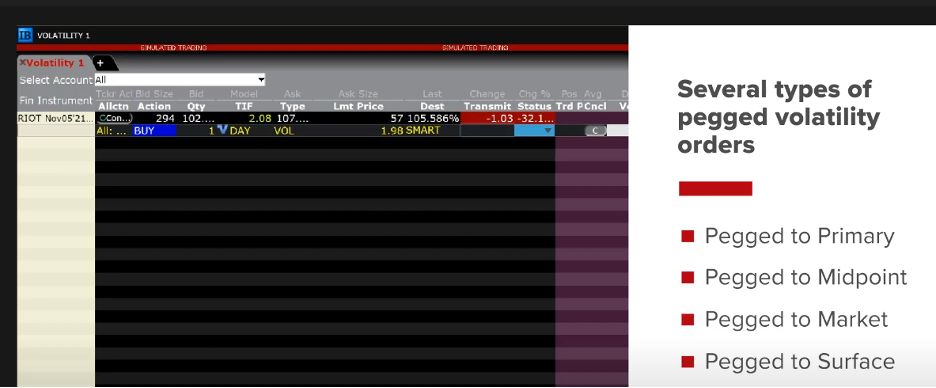
IBKR offers several types of pegged volatility orders including Pegged to Primary, Pegged to Midpoint, Pegged to Market, and Pegged to Surface.
We will now place a pegged to primary volatility order by clicking on the option line and setting the order type to “PEGPRIMVOL” A value will appear in the offset amount column. This is expressed in volatility terms and can be adjusted to be more or less aggressive depending on the value entered.
In Pegged to Primary orders the offset is tied to the bid for buy orders and ask for sell orders. I will adjust up to 11% and you will see the limit price increase. Click Transmit to send the order.
All of the volatility-based orders can be accessed in Classic TWS as well without bringing up the volatility trader.
As you can see volatility is an important part of option pricing, I hope you enjoyed this lesson on the TWS Volatility Lab and Volatility Trader.
Hi, is there a limit to the number of concurrent pegged to volatility orders?
Also, can pegged to volatility orders be GTC?
Thanks
Hello Matthew, thank you for reaching out. There is no limit, and pegged to volatility orders can be GTC. We hope this answers your question.
Hi.
How can we download this study notes?
Hi Tlaki, thank you for reaching out. We do not maintain PDFs of our study notes because lessons frequently change. You can copy and paste the text into a word processor, or right click in your browser, select print, then select print as PDF.
Hi, ,, Historical Volatility which is the same as Implied Volatility but set to show historical versus implied”.. it means that
the skew of Historical volatility is about underlying assets or usual HV, right?
Hi Michael, thank you for reaching out. The Implied Volatility (IV) window displays the measure of anticipated volatility of the stock using the prevailing option premium. This would allow you to display the volatility for any available expiration. You can choose the time period on the right-hand side. Historical Volatility (HV) plots a 30-day reading of both implied and historical volatility against the share price over a custom period you define. The Industry Comparison workspace provides a comparison of a stock’s volatility measures against those of comparable companies in the same industry group. We hope this helps!
https://www.interactivebrokers.com/en/trading/fif-volatility-lab.php