

")


Introduction
Understanding historical probabilities, historical outcomes, and current market conditions can help more investors get the likelihood of investing success in their favor.
In today’s newsletter, Drawing Capital utilizes a data-informed approach to analyze and assess historical data related to the S&P 500 Index, with specific attention on historical probabilities, percentage drawdowns in the S&P 500 Index, and the VIX, which is a measure of implied volatility in the near-term for the S&P 500 Index. While there are no guarantees or certainties in investing, getting the investing probabilities in one’s favor is obviously favorable.
Obviously, while future performance can deviate from historical returns, understanding the historical distribution of outcomes and event probabilities help to imagine investing possibilities and provide a historical context.
A quick note for SPX, VIX, and % Drawdowns:
- SPX is the referenced ticker symbol for the S&P 500 Index.
- VIX is the referenced ticker symbol for the CBOE Volatility Index.
- % Drawdown is the percentage drawdown from the prior local price peak. For example, if a prior peak price was $100/share and now the stock is trading at $85/share, then this is a 15% drawdown.
According to CBOE, “The VIX Index is a calculation designed to produce a measure of constant, 30-day expected volatility of the U.S. stock market, derived from real-time, mid-quote prices of S&P 500® Index (SPX℠) call and put options. On a global basis, it is one of the most recognized measures of volatility — widely reported by financial media and closely followed by a variety of market participants as a daily market indicator.”
Source: https://www.cboe.com/tradable_products/vix/.
Historical 1-Year Returns for the S&P 500 Index
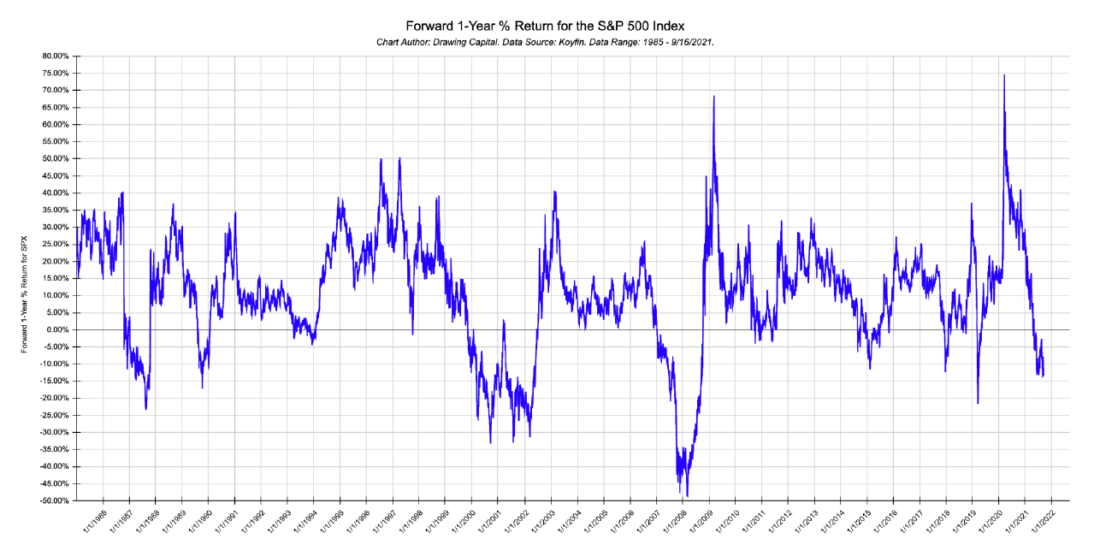
This graph charts the forward 1-year percentage change for the S&P 500 Index. A negative number indicates a negative percentage return. In contrast, large upward spikes (such as in March 2009 or late March 2020) indicate highly favorable buying entry points when buying a quality S&P 500 index fund.
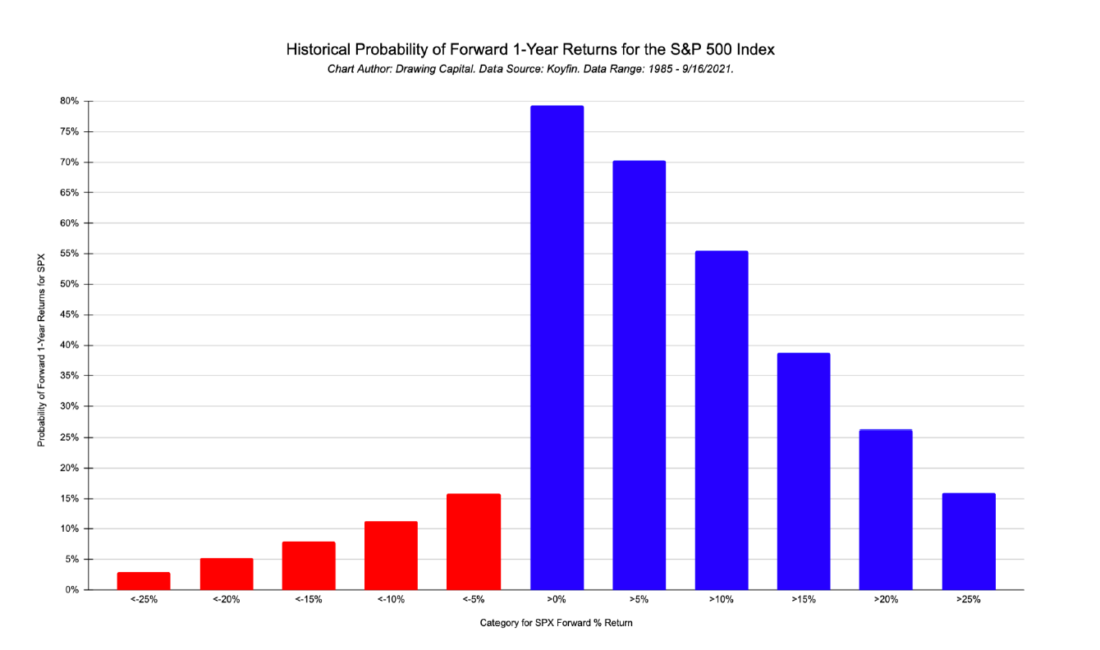
Key Insights:
- Since 1985, the probability of the S&P 500 Index having a positive 1-year return is about 79%. Said differently, there is a high historical probability that buying a quality S&P 500 Index fund yields a positive return one year after the purchase date.
- Since 1985, the probability of the S&P 500 Index having a greater than 10% return for a one-year time horizon is about 55%.
- Since 1985, the probability of the S&P 500 Index having a greater than 20% return for a one-year time horizon is about 26%.
- Across a rolling 1-year time period since 1985, there is a low likelihood of large percentage declines, although they do occur (and may be harsh to endure when they occur). For example, since 1985, there is only a 5% historical probability that the S&P 500 Index has a 1-year return that is worse than a -20% decline.
- These probabilities were calculated using the closing day prices for the S&P 500 Index (SPX), and the data is sourced from Koyfin.
- It is typically easier to compound returns over long time periods compared to very short durations. Time is a competitive advantage, and historically, increasing the investment time horizon for the S&P 500 Index has increased the probability of achieving positive returns.
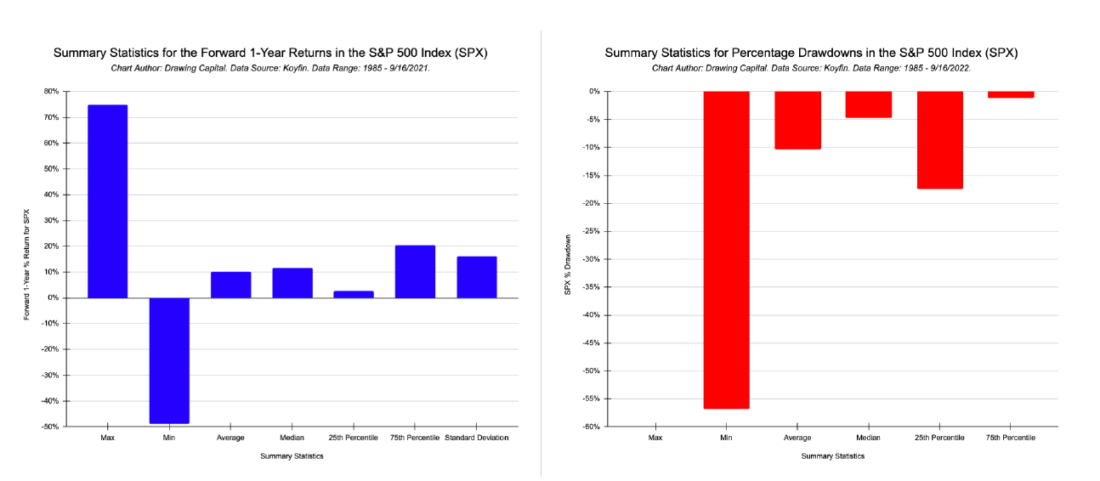
Key Insights:
- Since 1985, the rolling 1-year forward return for the S&P 500 Index is about +10.2% on average with a median of about +11.6%.
- Percentage drawdowns from peak prices are common. Since 1985, the average percentage drawdown in the S&P 500 Index is about -10%.
- The red chart on the right indicates that percentage drawdowns (and potential losses) are an embedded component of investing in the stock market. Since 1985, the worst percentage drawdown for the S&P 500 Index exceeded -50%, and the interquartile range for SPX percentage drawdowns between the 25th percentile and 75th percentile ranges between about -1% and -17%.
Volatility and Drawdowns
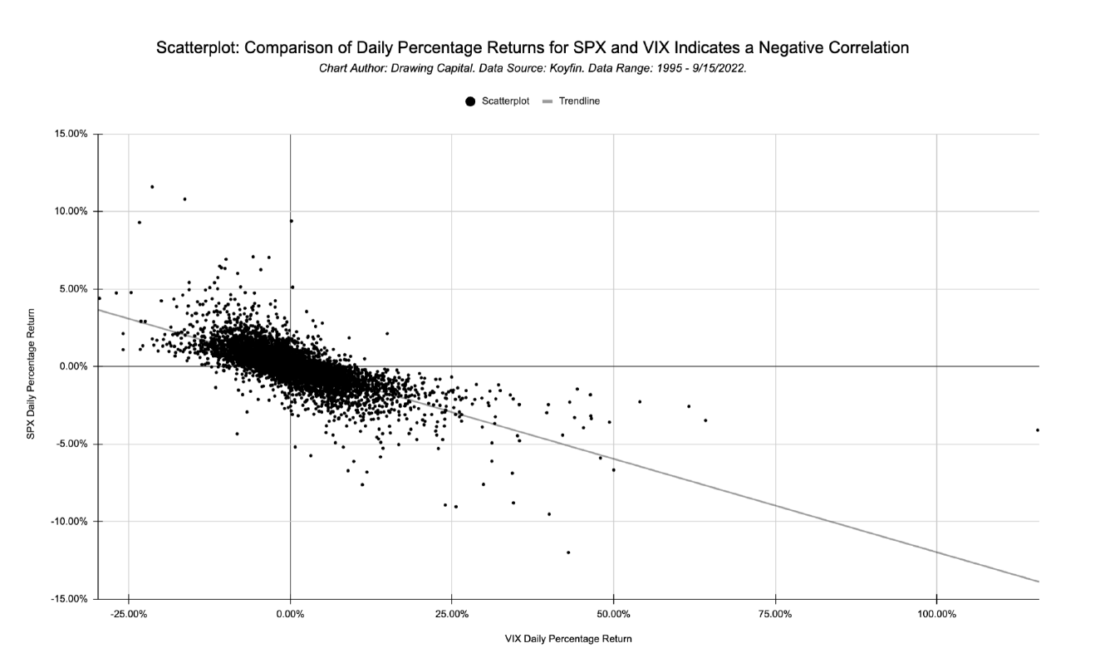
- The above chart plots the daily percentage returns for the SPX and VIX indices from 1995 to September 15, 2022.
- Since 1995, the correlation between the daily percentage returns for the SPX and VIX is about -0.72, indicating a notable negative correlation between SPX and the VIX.
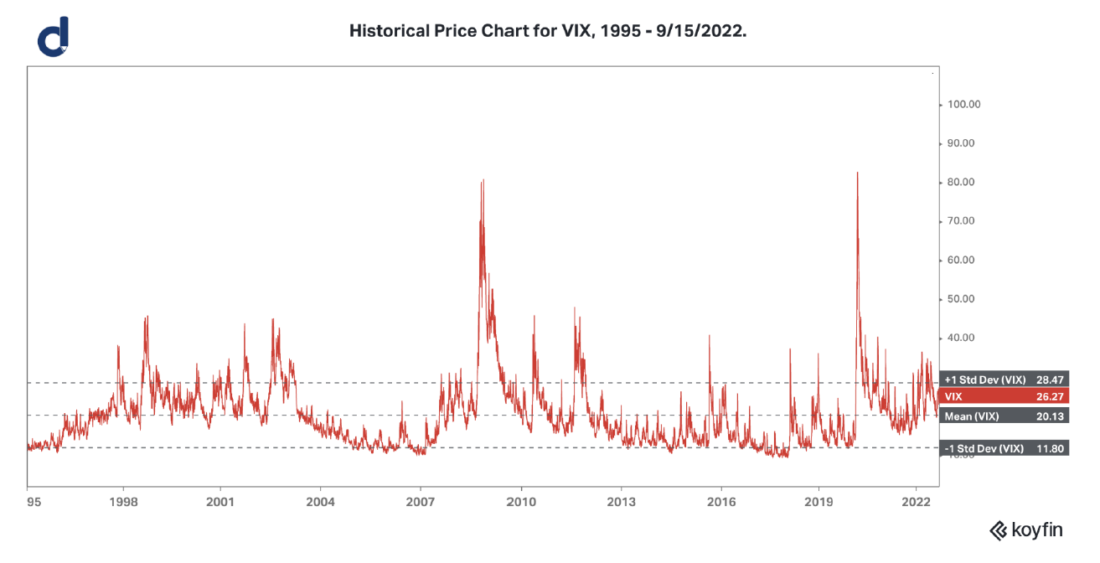
- The VIX provides a current market-implied viewpoint of how “Mr. Market” is thinking about the range in future price movements. Assessing this viewpoint, along with one’s own viewpoint, provides a perspective of allocating capital in equity markets.
- Volatility (as measured by the VIX for the S&P 500 Index, which is a popular benchmark index for the US stock market) is often spiky and mean-reverting. The VIX tends to be range-bound for the majority of the time with volatility spikes or periods of suppressed volatility.
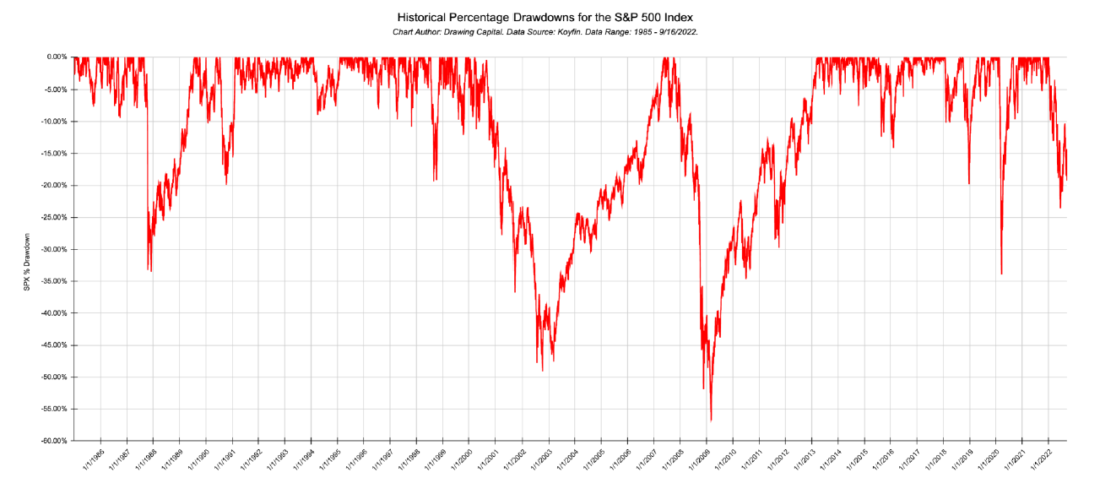
This chart illustrates the historical percentage drawdowns for the S&P 500 Index since 1985. Intuitively, it is straightforward to visualize that both the prior economic recessions and surges in fear and uncertainty in financial markets are connected with higher percentage drawdowns. For example, these time periods experienced a worse than -30% drawdown in the S&P 500 Index: 1987, 2001-2002, 2008-2009, and Q1 2020.
Categorization of Historical S&P 500 Index Returns via SPX Drawdowns and the VIX
The previous section discussed historical 1-year returns for the S&P 500 Index and reviewed the historical relationship between the S&P 500 Index and the VIX. With this historical context, we can expand further by categorizing the historical S&P 500 Index returns based on specific levels in volatility (VIX) and specific levels of percentage drawdowns in the S&P 500 Index. The goal of this categorization is to identify more favorable investing environments in hopes of improving the probability of future wins in investment outcomes.
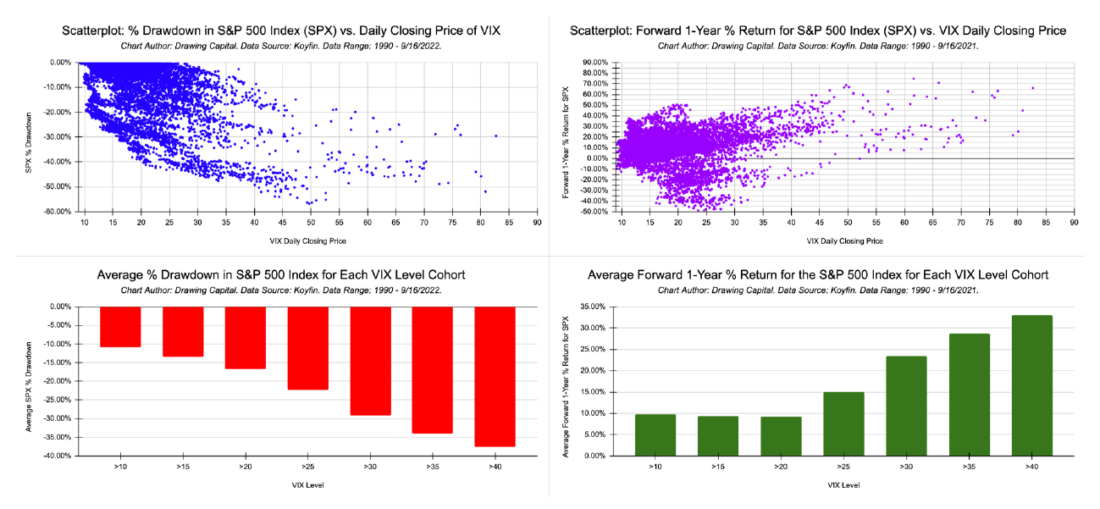
Key Insights:
- When the VIX is high and with the belief that VIX in the future may be lower, historically the potential implication is high current losses with high future opportunities. This description can be viewed in the bottom red and green charts in the dashboard:
- Historically and as displayed on the top-left blue chart, higher VIX levels often coincide with higher average percentage drawdowns in the S&P 500 Index.
- Interestingly, higher VIX levels often historically coincide with higher future returns on average, especially after the VIX exceeds 25. This observation can be seen via the purple and green charts on the right-side of the dashboard.
- The popular consensus viewpoint is that the VIX is a measure of implied volatility, fear, uncertainty, and doubt in the stock market (specifically the S&P 500 Index). High VIX levels imply high levels of volatility and a wider estimated range of future prices. Because the VIX and S&P 500 Index are inversely correlated (historical correlation is near -0.72), surges in VIX levels often coincide with a falling S&P 500 Index.
- Counterintuitive and Contrarian Viewpoint: In contrast to the consensus viewpoint that the VIX is a “fear index” that measures implied volatility, what if the VIX is actually a measure of future investing opportunity in the stock market?
- When the VIX is high, this implies potential large investment opportunities in the future; when the VIX is abnormally low, this implies a potential period of investor complacency, a level of investor confidence, and many assets perceived by many investors to be “fairly valued”.
- For example, in reviewing the bottom-right green chart in the dashboard, notice how the average historical 1-year future return for the S&P 500 Index greatly increases when the VIX is above 30.
- Historically since 1990, the average forward 1-year return for the S&P 500 Index when the VIX is above 40 is nearly 33%.
- It can be emotionally or behaviorally difficult to invest in the S&P 500 Index (such as via a quality S&P 500 index fund) when there is an abundance of current chaos, market volatility, and negative media headlines in financial news; yet, history suggests that favorable investment outcomes can occur on average when buying premium-quality assets at distressed prices.
- A counterintuitive investment perspective is to buy when there is both high volatility with the expectation that volatility will decline in the future because when there is max FUD (fear, uncertainty, and doubt), then market prices for quality assets are often trading at depressed or distressed prices, enabling smart investors to buy premium-quality assets at discounted prices.
- This contrarian viewpoint also aligns with economic logic for quality assets with persistently strong financial fundamentals and business performance: When prices get cheaper, the future opportunity gets better.
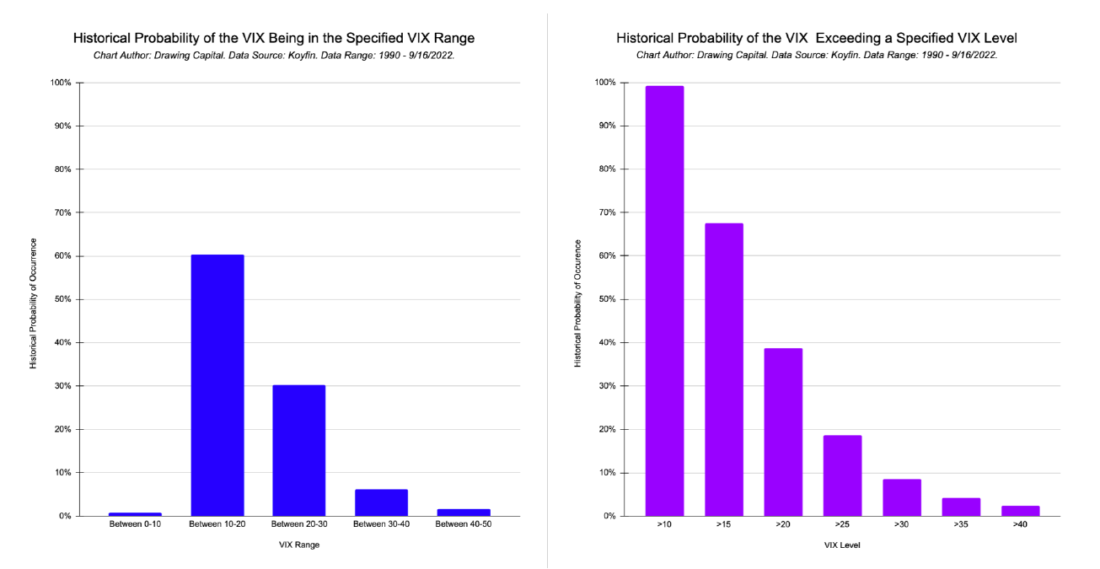
Key Insights:
- Skew exists in the historical probability of the VIX being within a specified range.
- Since 1990, the VIX has been between 10 and 20 for the majority of the time.
- Since 1990, the VIX exceeds 30 only about 9% of the time.
Key Insights:
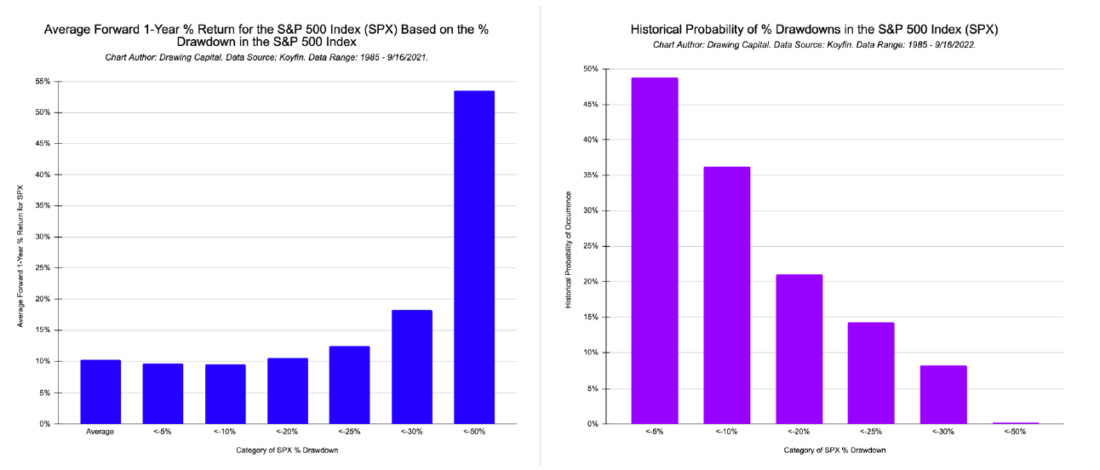
- Historically on average for the S&P 500 Index, the blue chart on the left indicates, validates, and aligns with economic logic: When prices get cheaper, the future opportunity gets better.
- The purple chart on the right highlights that drawdowns from peak prices are very common, implying that the S&P 500 Index is seldomly trading at all-time-high prices.
- Historically since 1985, there is a nearly 49% probability that the S&P 500 Index is experiencing a worse than -5% drawdown.
- Historically since 1985, there is a nearly 20% probability that the S&P 500 Index is experiencing a worse than -20% drawdown.
- Historically since 1985, there is a nearly 8% probability that the S&P 500 Index is experiencing a worse than -30% drawdown.
- Historically on average for the S&P 500 Index, a “buying the dip” approach has bigger benefits during bigger declines. Notice how the historical average forward 1-year performance of the S&P 500 Index since 1985 doesn’t meaningfully change between a <-5% or <-10% drawdown; in contrast, the historical average forward 1-year return of the S&P 500 Index is significantly higher when buying at prices that are greater than 30% below the prior peak price.
To receive more insights and ideas delivered straight to your inbox every week, please subscribe to Drawing Capital’s newsletter at drawingcapital.substack.com.
References:
- CBOE and VIX, https://www.cboe.com/tradable_products/vix/
- Koyfin, https://www.koyfin.com/home
This letter is not an offer to sell securities of any investment fund or a solicitation of offers to buy any such securities. An investment in any strategy, including the strategy described herein, involves a high degree of risk. Past performance of these strategies is not necessarily indicative of future results. There is the possibility of loss and all investment involves risk including the loss of principal.
Any projections, forecasts and estimates contained in this document are necessarily speculative in nature and are based upon certain assumptions. In addition, matters they describe are subject to known (and unknown) risks, uncertainties and other unpredictable factors, many of which are beyond Drawing Capital’s control. No representations or warranties are made as to the accuracy of such forward-looking statements. It can be expected that some or all of such forward-looking assumptions will not materialize or will vary significantly from actual results. Drawing Capital has no obligation to update, modify or amend this letter or to otherwise notify a reader thereof in the event that any matter stated herein, or any opinion, projection, forecast or estimate set forth herein, changes or subsequently becomes inaccurate.
This letter may not be reproduced in whole or in part without the express consent of Drawing Capital Group, LLC (“Drawing Capital”). The information in this letter was prepared by Drawing Capital and is believed by the Drawing Capital to be reliable and has been obtained from sources believed to be reliable. Drawing Capital makes no representation as to the accuracy or completeness of such information. Opinions, estimates and projections in this letter constitute the current judgment of Drawing Capital and are subject to change without notice.
Disclosure: Interactive Brokers
Information posted on IBKR Campus that is provided by third-parties does NOT constitute a recommendation that you should contract for the services of that third party. Third-party participants who contribute to IBKR Campus are independent of Interactive Brokers and Interactive Brokers does not make any representations or warranties concerning the services offered, their past or future performance, or the accuracy of the information provided by the third party. Past performance is no guarantee of future results.
This material is from Drawing Capital and is being posted with its permission. The views expressed in this material are solely those of the author and/or Drawing Capital and Interactive Brokers is not endorsing or recommending any investment or trading discussed in the material. This material is not and should not be construed as an offer to buy or sell any security. It should not be construed as research or investment advice or a recommendation to buy, sell or hold any security or commodity. This material does not and is not intended to take into account the particular financial conditions, investment objectives or requirements of individual customers. Before acting on this material, you should consider whether it is suitable for your particular circumstances and, as necessary, seek professional advice.
Disclosure: Options Trading
Options involve risk and are not suitable for all investors. Multiple leg strategies, including spreads, will incur multiple commission charges. For more information read the "Characteristics and Risks of Standardized Options" also known as the options disclosure document (ODD) or visit ibkr.com/occ