

")


This post shows how to read all prices of constituents of a stock index given all symbols as a string. It is a prerequisite of the pairs trading backtest.
Pairs trading aims to select good performing pairs from a set of universe of a stock index. It is, therefore, a starting point of pairs trading backtest to collect daily stock prices of a given stock index.
Sometimes there are symbols for which price information is not available. In this case, we should check the all components of the stock index. In case of Nasdaq 100, recent information can be found at
https://www.slickcharts.com/nasdaq100
R code
The following R code retreives historical daily prices of constituents of the Nasdaq 100 index given all symbols of it as of 2022-07-29.
#========================================================#
# Quantitative ALM, Financial Econometrics & Derivatives
# ML/DL using R, Python, Tensorflow by Sang-Heon Lee
#
# https://kiandlee.blogspot.com
#--------------------------------------------------------#
# load prices of constituents of a stock index
#========================================================#
graphics.off(); rm(list = ls())
library(quantmod)
#-------------------------------------------------
# Components of the Nasdaq 100, as of 2022-07-29
#-------------------------------------------------
vstr_nasdaq100 <-
"AAPL,MSFT,AMZN,TSLA,GOOG,GOOGL,NVDA,META,PEP,COST,
AVGO,CMCSA,ADBE,CSCO,TMUS,QCOM,INTC,TXN,AMD,AMGN,
HON,INTU,NFLX,PYPL,ADP,SBUX,AMAT,MDLZ,ADI,ISRG,
CHTR,GILD,BKNG,VRTX,CSX,MU,FISV,LRCX,REGN,MNA,
ATVI,SNPS,KLAC,KDP,MNST,MAR,AEP,CDNS,PANW,NXPI,
ASML,FTNT,ORLY,PAYX,MRVL,KHC,ADSK,EXC,CTAS,ABNB,
MELI,AZN,XEL,CRWD,EA,MCHP,CTSH,LULU,DLTR,WBA,
DXCM,ILMN,SGEN,IDXX,JD,BIIB,ODFL,PCAR,LCID,BIDU,
WDAY,CPRT,VRSK,TEAM,ROST,FAST,ZM,DDOG,EBAY,SIRI,
PDD,ANSS,ZS,ALGN,MTCH,VRSN,CEG,NTES,SWKS,SPLK,
OKTA,DOCU"
#-------------------------------------------
# split symbols and make vector
#-------------------------------------------
nasdaq100_symbols <-
gsub(" ", "", strsplit(vstr_nasdaq100,
"\\s*,\\s*")[[1]])
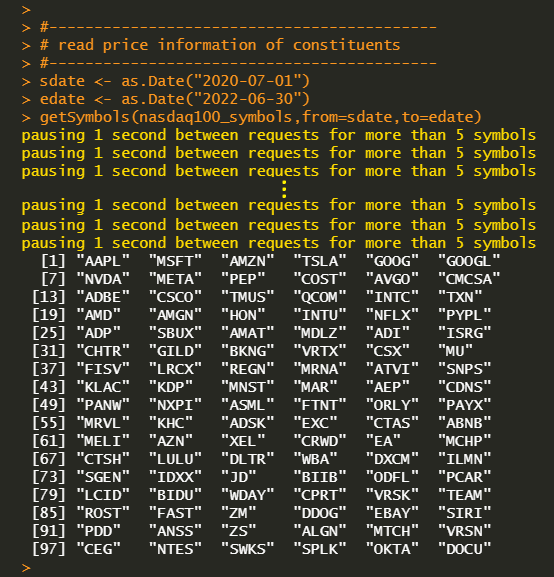
nasdaq100_symbols
#-------------------------------------------
# read price information of constituents
#-------------------------------------------
sdate <- as.Date("2020-07-01")
edate <- as.Date("2022-06-30")
getSymbols(nasdaq100_symbols,from=sdate,to=edate)
#-------------------------------------------
# collect only adjusted prices
#-------------------------------------------
price <- NULL
for(i in 1:length(nasdaq100_symbols)) {
eval(parse(text=paste0(
"price <- cbind(price,",
nasdaq100_symbols[i],"[,6])")))
}
# modify column name as only symbol
colnames(price) <-
gsub(".Adjusted", "", colnames(price))
#-------------------------------------------
# print price time series of Components
#-------------------------------------------
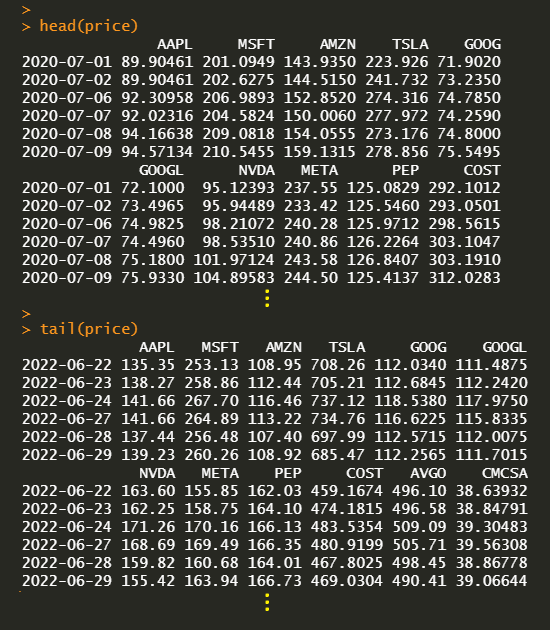
head(price)
tail(price)
Running the above R code displays the status of data reading process as follows.
Finally, we can get the collection of individual stock prices, which are components of the Nasdaq 100 index
Originally posted on SH Fintech Modeling.
Disclosure: Interactive Brokers
Information posted on IBKR Campus that is provided by third-parties does NOT constitute a recommendation that you should contract for the services of that third party. Third-party participants who contribute to IBKR Campus are independent of Interactive Brokers and Interactive Brokers does not make any representations or warranties concerning the services offered, their past or future performance, or the accuracy of the information provided by the third party. Past performance is no guarantee of future results.
This material is from SHLee AI Financial Model and is being posted with its permission. The views expressed in this material are solely those of the author and/or SHLee AI Financial Model and Interactive Brokers is not endorsing or recommending any investment or trading discussed in the material. This material is not and should not be construed as an offer to buy or sell any security. It should not be construed as research or investment advice or a recommendation to buy, sell or hold any security or commodity. This material does not and is not intended to take into account the particular financial conditions, investment objectives or requirements of individual customers. Before acting on this material, you should consider whether it is suitable for your particular circumstances and, as necessary, seek professional advice.
Join The Conversation
If you have a general question, it may already be covered in our FAQs. If you have an account-specific question or concern, please reach out to Client Services.