


The post “Bearish Candlestick Patterns Explained” first appeared on QuantInsti blog.
Excerpt
In the dynamic world of trading, understanding the language of the markets is imperative and that includes the most valuable skills of the ability to read and interpret candlestick patterns. Among these, bearish candlestick patterns stand out as crucial indicators of potential price declines. In this all-encompassing guide, we embark on an enlightening journey through the world of bearish candlestick patterns.
From unravelling their underlying concepts to grasping their diverse types, we will delve into the techniques that empower traders to identify, interpret, and capitalise on these telltale indicators.
Whether you’re a seasoned trader seeking to refine your skills or a newcomer looking for market mastery, this guide equips you with the essential insights into bearish candlestick patterns.
Some of the concepts covered in this blog are taken from this Quantra learning course on Candlestick Patterns based Automated Trading. You can take a Free Preview of the courses by clicking on the green-coloured Free Preview button.
This blog topic covers:
- What is a bearish candlestick pattern?
- Common types of bearish candlestick patterns
- Key factors to consider when identifying bearish patterns
- How do you read bearish candlestick patterns?
- What are bearish indicators?
- Trading Strategies for Bearish Candlestick Patterns
- Bearish vs bullish candlestick patterns
- Pros of using bearish candlestick patterns
What is a bearish candlestick pattern?
A bearish candlestick pattern is a visual representation of price movement on a trading chart that suggests a potential downward trend or price decline in an asset.
It’s formed by the arrangement of the candle’s open, close, high, and low prices, creating a specific pattern that indicates selling pressure and a possible shift in market sentiment towards pessimism. Traders use these patterns to anticipate and make informed decisions about potential market downturns.
Common types of bearish candlestick patterns
You might have heard of patterns like the Bearish Engulfing, Evening Star, and more – they each signal potential price drops. These patterns are like clues that traders analyse to make informed decisions.
Let us see some common types of bearish candlestick patterns below.
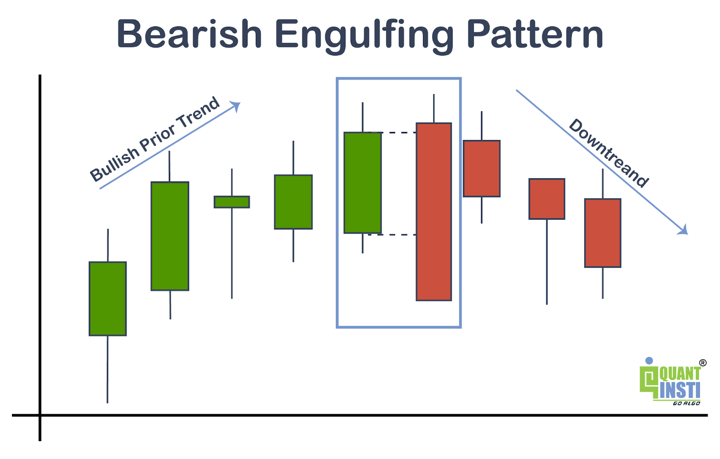
Bearish Engulfing Pattern
This occurs when a larger bearish candle fully engulfs the previous smaller bullish candle, suggesting a reversal from an uptrend to a potential downtrend.
You can see the same in the image below.
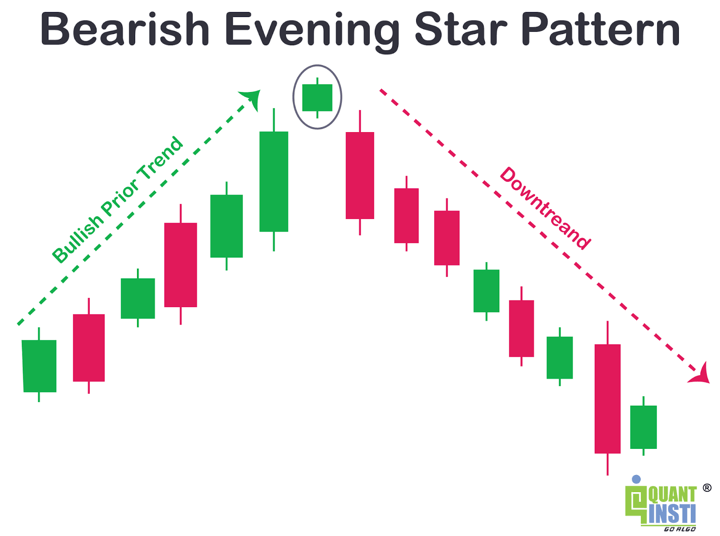
Evening Star Pattern
Comprising three candles, the evening star pattern starts with a bullish candle, followed by a small-bodied or doji candle, and then a larger bearish candle. It signifies a potential reversal.
Here is an image to get a clear idea about an evening star pattern.
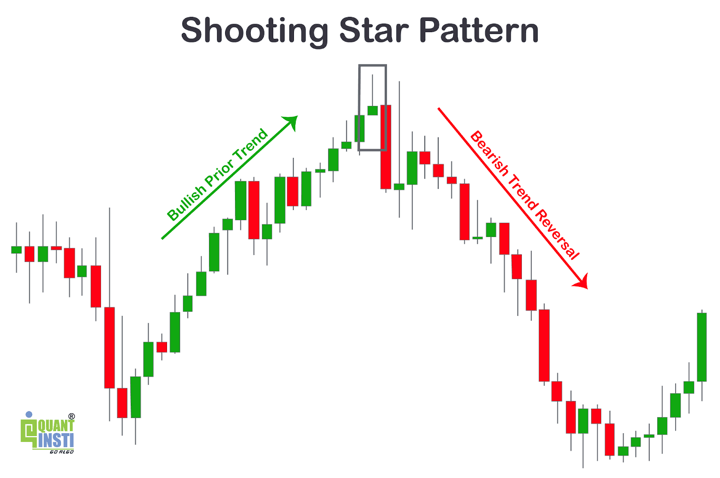
Shooting Star Pattern
A single candle with a long upper wick and a small body, indicating an unsuccessful attempt by buyers to push prices higher. It’s often seen at the end of an uptrend.
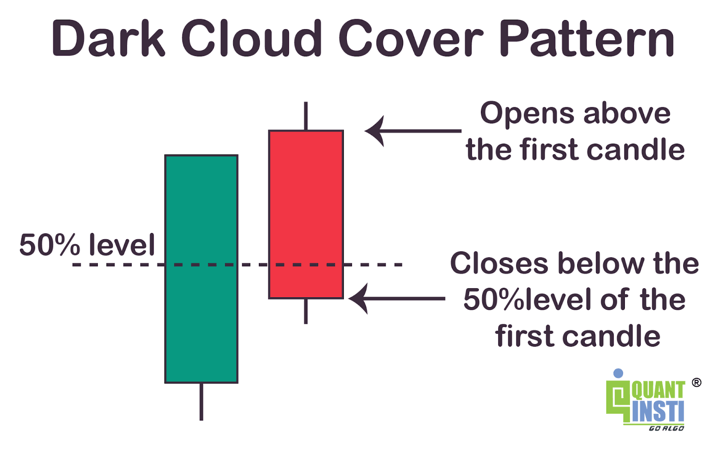
Dark Cloud Cover Pattern
Formed by two candles, this pattern starts with a bullish candle followed by a bearish candle that opens above the previous candle’s high and closes below its midpoint, indicating potential selling pressure.
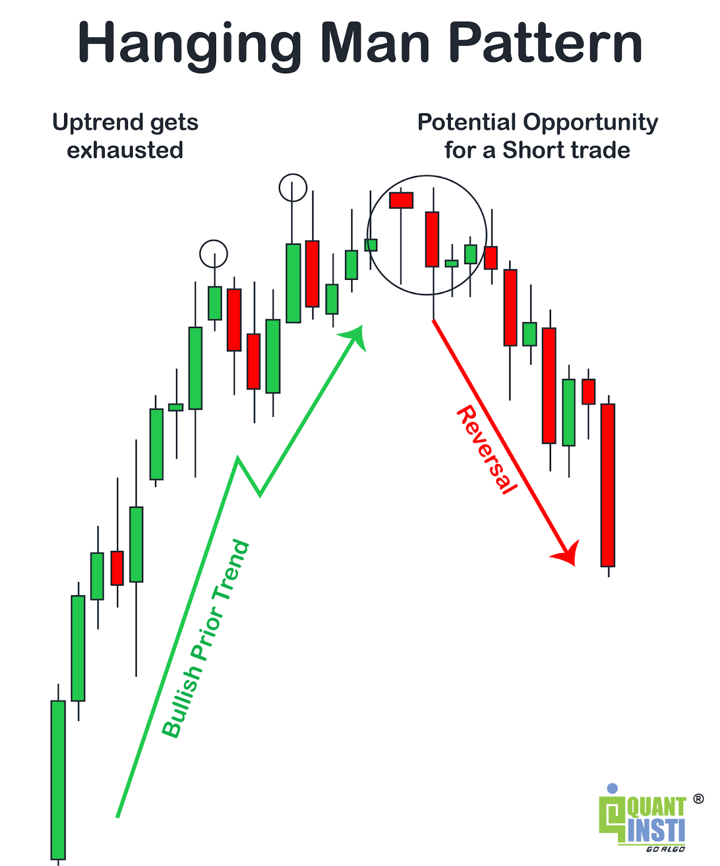
Hanging Man Pattern
Similar to the shooting star but appears at the end of a downtrend, the hanging man has a small body and a long lower wick, suggesting potential bullish reversal.
Visit QuantInsti blog to read about key factors to consider when identifying bearish patterns.
Disclosure: Interactive Brokers
Information posted on IBKR Campus that is provided by third-parties does NOT constitute a recommendation that you should contract for the services of that third party. Third-party participants who contribute to IBKR Campus are independent of Interactive Brokers and Interactive Brokers does not make any representations or warranties concerning the services offered, their past or future performance, or the accuracy of the information provided by the third party. Past performance is no guarantee of future results.
This material is from QuantInsti and is being posted with its permission. The views expressed in this material are solely those of the author and/or QuantInsti and Interactive Brokers is not endorsing or recommending any investment or trading discussed in the material. This material is not and should not be construed as an offer to buy or sell any security. It should not be construed as research or investment advice or a recommendation to buy, sell or hold any security or commodity. This material does not and is not intended to take into account the particular financial conditions, investment objectives or requirements of individual customers. Before acting on this material, you should consider whether it is suitable for your particular circumstances and, as necessary, seek professional advice.
Join The Conversation
If you have a general question, it may already be covered in our FAQs. If you have an account-specific question or concern, please reach out to Client Services.