


A convexity is needed to describe a non-linearity of a bond price, which is absent in a duration. This post explains the meaning and calculation process of the convexity by using Excel and R.
We have calculated a bond duration in the previous post
Bond Price
Bond price with unit notional amount, coupon C, YTM y, annual frequency is as follows.

Convexity
As a bond yield decreases, its price rises at an increasing rate, whereas a bond’s price falls at a decreasing rate as its yield increases. This asymmetric behavior is known as convexity. Let’s derive convexity in the same manner by which duration is derived.
At first, the second order derivative of P with respect to y.
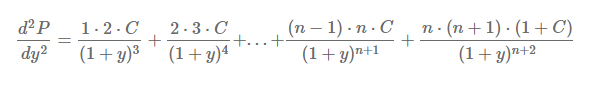
Like the duration, factoring out ![]() in the above equation yields
in the above equation yields
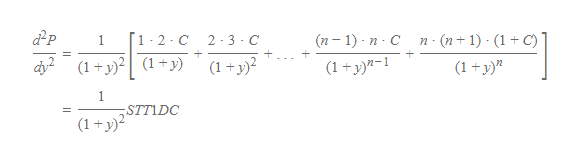
To avoid lengthy expression, we substitute STT1DC for the bracketed term. STT1DC is the abbreviation of the sum of multiplications of time and time + 1 and discounted cash flow (only coupon or coupon + principal amount).
Similar to the duration in the previous post, let’s modify it by a ratio of its initial bond price. Dividing ![]() by P gives the following expression for the convexity (C) of a bond.
by P gives the following expression for the convexity (C) of a bond.

Rearranging this equation, we can get the following expression.

Generalization
When interest conversion period is less than one year such as one quarter, convexity is redefined as follows.

Here, k is the number of compounding periods per year.
Effective Convexity and Duration
Effective convexity (C) is obtained from the numerical differentiation like the effective duration (D).

Here, P0 denotes an initial bond price with yield to maturity (y). Pu and Pd represent bond prices after downward (y − Δy) and upward (y + Δy) shocks to interest rates (yield to maturity) respectively.
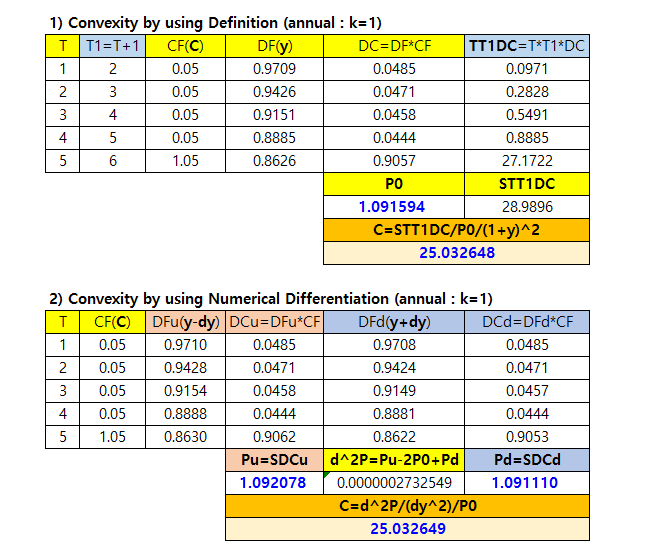
Excel Illustration
To the best of our knowledge, Excel does not provides a built-in function for the calculation of convexity. Therefore, we calculate convexity by using the definition and the numerical differentiation for our clear understanding. As an example, we use the same specification of bond as in the previous post. Specifically, coupon rate (C), YTM (y), maturity (m), and interest rate change (Δy) are 5%, 3%, 5-year, and 0.0001 (1bp) respectively.
The following Excel spreadsheet shows the case of k=1.
The following Excel spreadsheet shows the case of k=4.
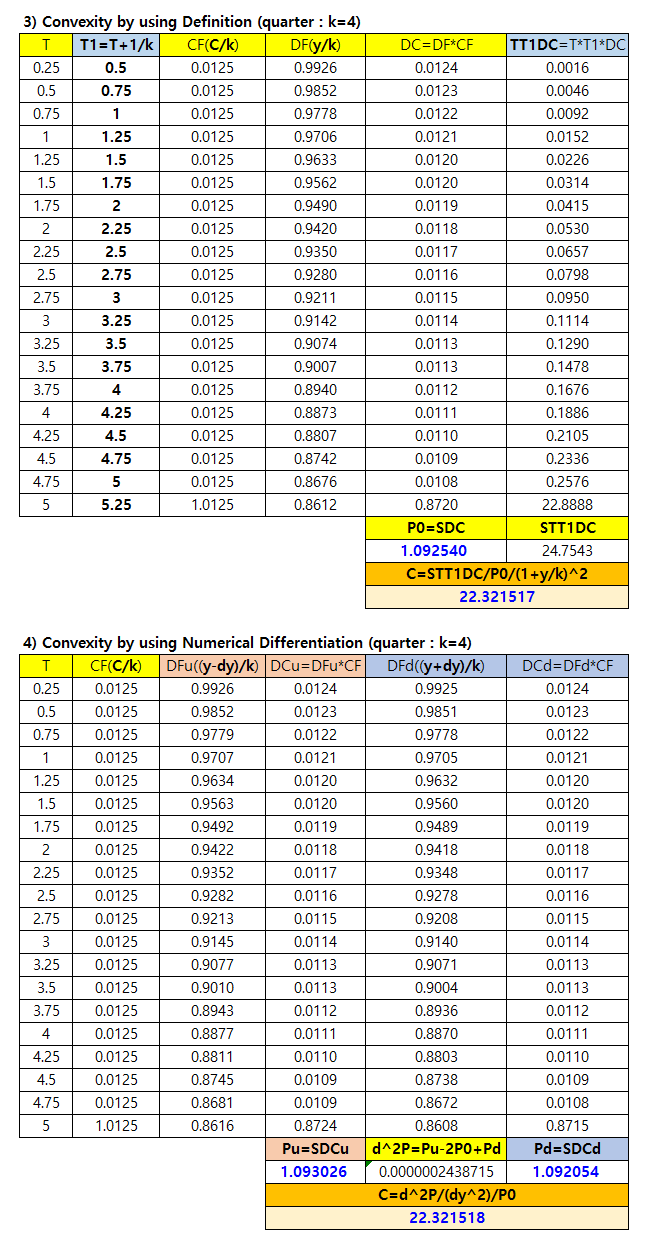
It is worthwhile to note that when k > 1, t + 1 in the convexity definition means t + 1/k.
R code
The following R code use derivmkts R package library which provides functions for the calculations of price, yield, duration, and convexity of a coupon bond. The reason why we use this library is that manual implementation of convexity in R is not very different from the case of the duration in the previous post.
#========================================================#
# Quantitative ALM, Financial Econometrics & Derivatives
# ML/DL using R, Python, Tensorflow by Sang-Heon Lee
#
# https://shleeai.blogspot.com
#--------------------------------------------------------#
# Convexity and (modified) Duration
#========================================================#

graphics.off()  # clear all graphs
rm(list = ls()) # remove all files from your workspace

library(derivmkts) # price, yield, duration, convexity

#-------------------------------------------------------
# Input
#-------------------------------------------------------
C   <- 0.05       # coupon rate
y   <- 0.03       # YTM
m   <- 5          # maturity
P   <- 1          # principal amount
cpn <- C*P       # annual coupon amount

# k = 1 : coupon payments annually
freq  <- 1
price <- bondpv(cpn, m, y, P, freq)
duration (price, cpn, m, P, freq, modified = TRUE)
convexity(price, cpn, m, P, freq)

# k = 4 : coupon payments quarterly
freq  <- 4
price <- bondpv(cpn, m, y, P, freq)
duration (price, cpn, m, P, freq, modified = TRUE)
convexity(price, cpn, m, P, freq)
Running the above R code results in the same output as those of Excel illustration.
> freq  <- 1
> price <- bondpv(cpn, m, y, P, freq)
> duration(price, cpn, m, P, freq, modified = TRUE)
[1] 4.43501
> convexity(price, cpn, m, P, freq)
[1] 25.03265
>
> freq  <- 4
> price <- bondpv(cpn, m, y, P, freq)
> duration(price, cpn, m, P, freq, modified = TRUE)
[1] 4.450557
> convexity(price, cpn, m, P, freq)
[1] 22.32152
>
Final Thoughts
From this post, we have understood the meaning of convexity by using an simple derivation and Excel illustration. Finally owing to derivmkt R package, we can easily implement R code for the calculation of convexity not to mention duration and price of a bond. Now we are ready to describes the percent(%) change of bond price more precisely with the help of duration and convexity. This topic will be covered in the next post.
Originally posted on SHLee AI Financial Model blog.
Disclosure: Interactive Brokers
Information posted on IBKR Campus that is provided by third-parties does NOT constitute a recommendation that you should contract for the services of that third party. Third-party participants who contribute to IBKR Campus are independent of Interactive Brokers and Interactive Brokers does not make any representations or warranties concerning the services offered, their past or future performance, or the accuracy of the information provided by the third party. Past performance is no guarantee of future results.
This material is from SHLee AI Financial Model and is being posted with its permission. The views expressed in this material are solely those of the author and/or SHLee AI Financial Model and Interactive Brokers is not endorsing or recommending any investment or trading discussed in the material. This material is not and should not be construed as an offer to buy or sell any security. It should not be construed as research or investment advice or a recommendation to buy, sell or hold any security or commodity. This material does not and is not intended to take into account the particular financial conditions, investment objectives or requirements of individual customers. Before acting on this material, you should consider whether it is suitable for your particular circumstances and, as necessary, seek professional advice.
Join The Conversation
If you have a general question, it may already be covered in our FAQs. If you have an account-specific question or concern, please reach out to Client Services.