


See Part I to get started.
Central Limit Theorem: Statement & Assumptions
Suppose we are taking repeated samples of size ‘n’ from a population with any kind of probability distribution. Then, the Central Limit Theorem states that given a high enough sample size, the following properties hold true:
- Sampling distribution’s mean = Population mean (μ)(μ), and
- Sampling distribution’s standard deviation (standard error) = σ/√nσ/√n, such that for n ≥ 30, the sampling distribution tends to a normal distribution for all practical purposes.
In the next section, we will try to understand the workings of the CLT with the help of simulations in Python.
Demonstration of CLT in action using simulations in Python with examples
The main point demonstrated in this section will be that for a population following any distribution, the sampling distribution (sample mean’s distribution) will tend to be normally distributed for a large enough sample size.
We will consider two examples and check whether the CLT holds.
Example 1: Exponentially distributed population
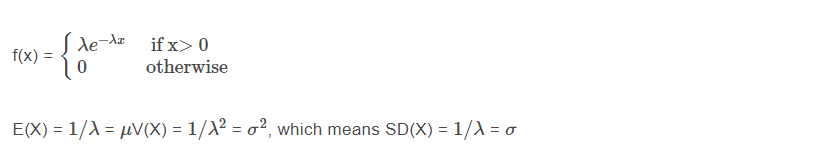
Suppose we are dealing with a population which is exponentially distributed. Exponential distribution is a continuous distribution that is often used to model the expected time one needs to wait before the occurrence of an event.
The main parameter of exponential distribution is the ‘rate’ parameter λλ, such that both the mean and the standard deviation of the distribution are given by (1/λ)(1/λ).
The following represents our exponentially distributed population:
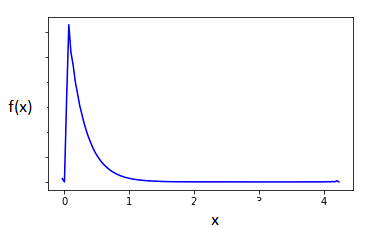
We can see that the distribution of our population is far from normal! In the following code, assuming that λλ=0.25, we calculate the mean and the standard deviation of the population:
# Importing necessary libraries
import warnings
warnings.filterwarnings(‘ignore’)
import pandas as pd, numpy as np
import matplotlib.pyplot as plt
%matplotlib inline
import seaborn as sns
# rate parameter for the exponentially distributed population
rate = 0.25
#Population mean
mu = 1/rate
# Population standard deviation
sd = np.sqrt(1/(rate**2))
print(‘Population mean:’, mu)
print(‘Population standard deviation:’, sd)
Population mean: 4.0
Population standard deviation: 4.0
Stay tuned for the next installment, in which Ashutosh Dave will see how the sampling distribution looks for this population and will consider two cases, i.e. with a small sample size (n= 2), and a large sample size (n=500).
Visit QuantInsti for additional details and to download full code: https://blog.quantinsti.com/central-limit-theorem/.
Disclaimer: All investments and trading in the stock market involve risk. Any decisions to place trades in the financial markets, including trading in stock or options or other financial instruments is a personal decision that should only be made after thorough research, including a personal risk and financial assessment and the engagement of professional assistance to the extent you believe necessary. The trading strategies or related information mentioned in this article is for informational purposes only.
Disclosure: Interactive Brokers
Information posted on IBKR Campus that is provided by third-parties does NOT constitute a recommendation that you should contract for the services of that third party. Third-party participants who contribute to IBKR Campus are independent of Interactive Brokers and Interactive Brokers does not make any representations or warranties concerning the services offered, their past or future performance, or the accuracy of the information provided by the third party. Past performance is no guarantee of future results.
This material is from QuantInsti and is being posted with its permission. The views expressed in this material are solely those of the author and/or QuantInsti and Interactive Brokers is not endorsing or recommending any investment or trading discussed in the material. This material is not and should not be construed as an offer to buy or sell any security. It should not be construed as research or investment advice or a recommendation to buy, sell or hold any security or commodity. This material does not and is not intended to take into account the particular financial conditions, investment objectives or requirements of individual customers. Before acting on this material, you should consider whether it is suitable for your particular circumstances and, as necessary, seek professional advice.