


Originally posted on QuantInsti blog.
You can also download the python code and dataset from my github a/c
Excerpt
In this article, we are going to develop a machine learning technique called Deep learning (Artificial Neural network) by using tensor flow and predicting stock price in python. At the end of this article you will learn how to build artificial neural network by using tensor flow and how to code a strategy using the predictions from the neural network.
System Requirements: Python 3.6
If you are new to Neural Networks and would like to gain an understanding of their working, I would recommend you to go through the following blogs before building a neural network.
Working of neural networks for stock price prediction
Training neural networks for stock price prediction
Coding The Strategy
Importing Libraries
We will start by importing all libraries. Please note if the below library not installed yet you need to install 1st in anaconda prompt before importing.
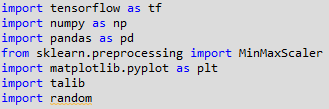
TensorFlow is an open-source software library for dataflow programming across a range of tasks. It is a symbolic math library, and is used for machine learning applications such as deep learning neural networks. Wikipedia.
Numpy is a fundamental package for scientific computing, we will be using this library for computations on our dataset. The library is imported using the alias np.
Pandas will help us in using the powerful dataframe object, which will be used throughout the code for building the artificial neural network in Python.
Scikit-learn is a free software machine learning library for the Python programming language. It features various classification, regression and clustering algorithms including support vector machines. Wikipedia
Matplotlib is a Python 2D plotting library which produces publication quality figures in a variety of hardcopy formats and interactive environments across platforms
Talib is a technical analysis library, which will be used to compute the RSI and Williams %R. These will be used as features for training our artificial neural network. We could add more features using this library.
Importing the dataset
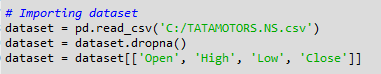
We are going to use daily OHLC data for the stock of Tata Motors trading on NSE for the time period from 1st January 2000 to 30 Aug 2018. We 1st import our dataset .CSV file named ‘TATAMOTORS.NS.csv’ saved in personal drive in your computer. This is done using the pandas library, and the data is stored in a dataframe named dataset. We then drop the missing values in the dataset using the dropna() function. We choose only the OHLC data from this dataset, which would also contain the Date, Adjusted Close and Volume data. We will be building our input features by using only the OHLC values.
Please note you can also download these data from my github.
Preparing the dataset
We then prepare the various input features which will be used by the artificial neural network to train itself for making the predictions. Please note I have limited to only below 8 features, however you should create more to get more accurate result.
- High minus Low price
- Close minus Open price
- Three day moving average
- Ten day moving average
- 30 day moving average
- Standard deviation for a period of 5 days
- Relative Strength Index
- Williams %R

We then define the output value as price rise, which is a binary variable storing 1 when the closing price of tomorrow is greater than the closing price of today.

Next, we drop all the rows storing NaN values by using the dropna() function.
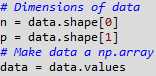
Next, we remove all OHLC data from “dataset” and keep only “8 input features” and “Output” in a new data frame named as “data”.
Next, we make all data in data a np.array.
Splitting the dataset
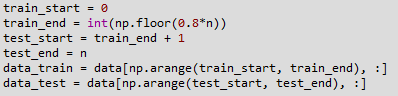
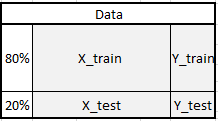
Next, we split the whole dataset into training and test data. The training data contained 1st 80% of the total dataset starting from 01 Jan 2000 and test data contained remaining 20% of data set. The data was not shuffled but sequentially sliced.
Scaling data & Building X, Y
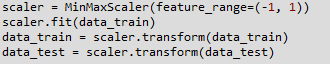
Another important step in data pre-processing is to standardize the dataset. This process makes the mean of all the input features equal to zero and also converts their variance to 1. This ensures that there is no bias while training the model due to the different scales of all input features. If this is not done the neural network might get confused and give a higher weight to those features which have a higher average value than others. Also, most common activation functions of the network’s neurons such as tanh or sigmoid are defined on the [-1, 1] or [0, 1] interval respectively. Nowadays, rectified linear unit (ReLU) activations are commonly used activations which are unbounded on the axis of possible activation values. However, we will scale both the inputs and targets. We will do Scaling using sklearn’s MinMaxScaler. We instantiate the variable sc with the MinMaxScalerr() function. After which we use the fit & then transform function train and test dataset.
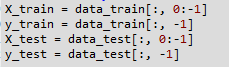
We then split the train and test dataset into Xtrain, ytrain & Xtest, ytest. This selects the target and predictors from datatrain and datatest. The target which is price rise (ytrain & ytest) is located in the last column of datatrain/test, the predictors which 8 features (Xtrain & Xtest) from 1st column to 8th column datatrain/test. The whole dataset will look like below.
This is an essential part of any machine learning algorithm, the training data is used by the model to arrive at the weights of the model. The test dataset is used to see how the model will perform on new data which would be fed into the model. The test dataset also has the actual value for the output, which helps us in understanding how efficient the model is. Now that the datasets are ready, we may proceed with building the Artificial Neural Network using the TensorFlow library.
Visit QuantInsti to read about Building The Artificial Neural Network.
Disclosure: Interactive Brokers
Information posted on IBKR Campus that is provided by third-parties does NOT constitute a recommendation that you should contract for the services of that third party. Third-party participants who contribute to IBKR Campus are independent of Interactive Brokers and Interactive Brokers does not make any representations or warranties concerning the services offered, their past or future performance, or the accuracy of the information provided by the third party. Past performance is no guarantee of future results.
This material is from QuantInsti and is being posted with its permission. The views expressed in this material are solely those of the author and/or QuantInsti and Interactive Brokers is not endorsing or recommending any investment or trading discussed in the material. This material is not and should not be construed as an offer to buy or sell any security. It should not be construed as research or investment advice or a recommendation to buy, sell or hold any security or commodity. This material does not and is not intended to take into account the particular financial conditions, investment objectives or requirements of individual customers. Before acting on this material, you should consider whether it is suitable for your particular circumstances and, as necessary, seek professional advice.
Join The Conversation
If you have a general question, it may already be covered in our FAQs. If you have an account-specific question or concern, please reach out to Client Services.