


Author: Updated by Chainika Thakar (Originally written by Vibhu Singh)
Hierarchical clustering is a powerful technique in the realm of data analysis and pattern recognition, offering a nuanced understanding of the relationships within datasets. This comprehensive guide delves into the intricacies of hierarchical clustering, specifically tailored for implementation in Python.
As the volume of raw data continues to increase rapidly, the prominence of unsupervised learning has grown. The primary objective of unsupervised learning is to unveil latent and intriguing patterns within unannotated datasets. Clustering stands out as the predominant algorithm in unsupervised learning, with applications spanning diverse domains—from medical diagnostics and facial recognition to stock market analysis. This blog specifically explores the intricacies of Hierarchical Clustering.
By the end of this guide, readers will not only have a robust grasp of the theory behind hierarchical clustering but will also be equipped to apply this knowledge effectively using Python, ensuring a seamless integration of this powerful analytical tool into their data science toolkit.
This blog covers:
- What is hierarchical clustering?
- Example of hierarchical clustering
- Difference between clustering and classification
- Importance of K-Means in hierarchical clustering
- Difference between K-means clustering and hierarchical clustering
- Key concepts of hierarchical clustering
- How to identify if two clusters are similar?
- What is a dendrogram?
- Types of hierarchical clustering
- Agglomerative hierarchical clustering
- Divisive hierarchical clustering
- How to do hierarchical clustering in Python?
- Pros of hierarchical clustering in trading
- Cons of hierarchical clustering in trading
- Applications of hierarchical clustering
What is hierarchical clustering?
Hierarchical clustering is a technique in unsupervised machine learning that involves the organisation of data into a hierarchy of nested clusters. Unlike other clustering methods, hierarchical clustering creates a tree-like structure of clusters (dendrogram), which visually represents the relationships between data points.
- You can check out this introductory video on hierarchical clustering which is a free preview. This link will be accessible only after logging into the Quantra website.
- Further, you can enroll into our course on portfolio management using machine learning. In this course, starting from the video on “hierarchical clustering on stocks” in Section 8, unit 4 you shall get help with further learning about the implementation of hierarchical clustering in the trading domain.
Example of hierarchical clustering
In the realm of portfolio creation, envision a scenario where we seek to evaluate stock performance. Employing hierarchical clustering allows us to group akin stocks based on performance similarities, creating clusters grounded in shared financial traits like volatility, earnings growth, and price-to-earnings ratio.
Difference between clustering and classification
Both classification and clustering try to group the data points into one or more classes based on the similarity of various features. The difference lies in the way both works.
Classification is a supervised algorithm, where there are predefined labels (yi) assigned to each input data point (Xi).
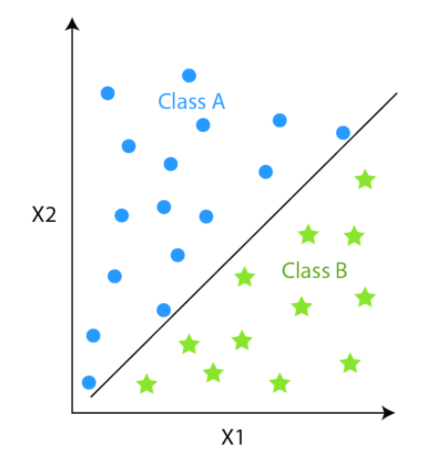
Whereas, clustering is an unsupervised algorithm where labels are missing meaning the dataset contains only input data points (Xi).
The other major difference is since classification techniques have labels, there is a need for training and test datasets to verify the model. In clustering, there are no labels so there is no need for training and test datasets.
Popular examples of classification algorithms are:
- Logistic Regression
- Support Vector Classifier
- Naive Bayes
- Decision Trees
- Random Forest
- Neural Networks
Examples of clustering algorithms are:
- Hierarchical clustering
- K-Means Clustering
- Mean Shift Clustering
- Spectral Clustering
Let us see the difference between hierarchical clustering and classification which is explained briefly in the table below.
| Aspect | Hierarchical Clustering | Classification |
| Objective | Groups data points into hierarchical clusters | Assign labels to data points |
| Type of Learning | Unsupervised learning | Supervised learning |
| Training Data | No predefined classes; clusters based on similarity | Requires labelled training data |
| Output | Dendrogram showing hierarchical cluster structure | Predicted class labels for new data |
| Algorithm Goal | Discover inherent structures and relationships | Learn patterns for accurate predictions |
| Usage | Exploratory data analysis; pattern discovery | Predictive modelling; assigning labels |
| Example | Grouping stocks based on price movements | Predicting stock trends as bullish/bearish |
In this article, we will deep dive into the details of only hierarchical clustering.
Importance of K-Means in Hierarchical Clustering
The answer to why we need Hierarchical clustering lies in the process of K-means clustering.
We will understand the K-means clustering in a layman’s language.
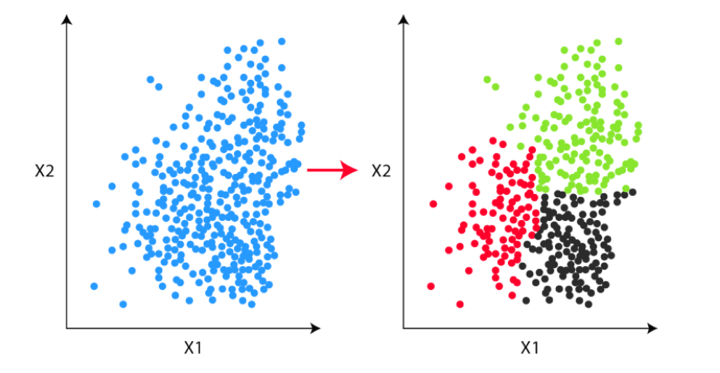
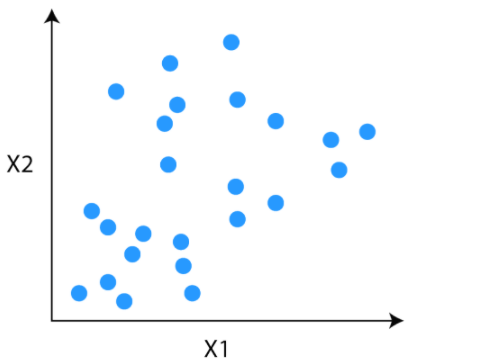
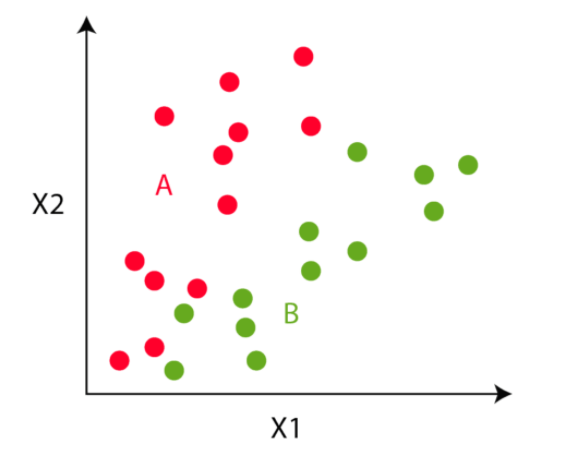
Consider this unlabeled data for our problem. Our task is to group the unlabeled data into clusters using K-means clustering.
Step 1
The first step is to decide the number of clusters (k). Let’s say we have decided to divide the data into two clusters.
Step 2
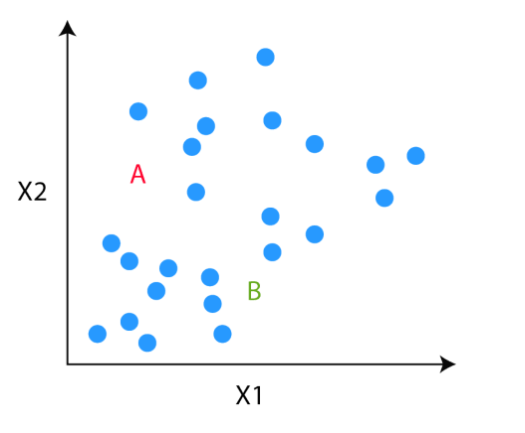
Once the clusters are decided, we randomly initialise two points, called the cluster centroids.
Step 3
In the third step, the algorithm goes to each of the data points and divides the points into respective classes, depending on whether it is closer to the red cluster centroid or green cluster centroid.
Step 4
In the fourth step, we move to the centroid step. We compute the mean of all the red points and move the red cluster centroid there and do the same for the green cluster centroid.
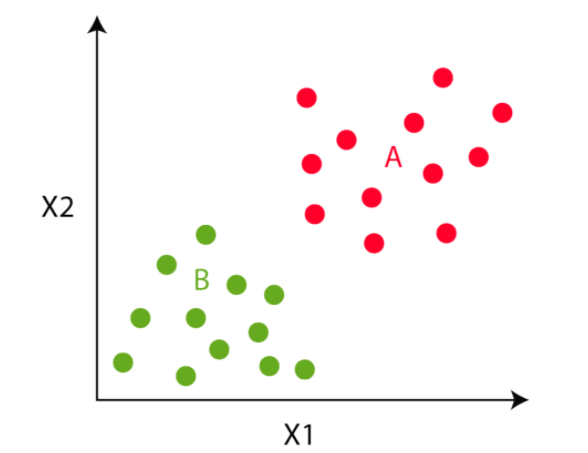
We will do steps 3 and 4 till the cluster centroid will not move any further. That is in this example, the colours of the point will not change any further.
The K-means process looks good, right?
Yes, but there is one problem or we can say the limitation of this process. At the beginning of the algorithm, we need to decide the number of clusters. But we don’t know how many clusters we need at the start.
Hierarchical clustering bridges this gap. In hierarchical clustering, we don’t need to define the number of clusters at the beginning.
Difference between K-means clustering and hierarchical clustering
Now, let us find out the difference between K-means clustering and hierarchical clustering. There is a thin line difference between the two and hence, it is important to find out the significant concepts that make each different from the other.
Below you can see the tabular representation of the same.
| Aspect | K-Means Clustering | Hierarchical Clustering |
| Objective | Partition data into distinct clusters, where each cluster has similar data points. For instance, in trading, you might use K-means to group stocks based on similar volatility patterns. | Group data into hierarchical clusters, forming a tree-like structure (dendrogram). For instance, hierarchical clustering could help create a hierarchy of stocks based on their correlation, indicating how closely related they are. |
| The number of Clusters | Predefined before clustering, and the algorithm aims to assign data points to the specified number of clusters. In trading, you might decide to group stocks into, say, three clusters based on specific criteria like price movements. | Not predefined; the algorithm forms a dendrogram, allowing you to decide the number of clusters based on where you cut the tree. This flexibility can be useful when the optimal number of clusters is not known in advance. For instance, you might identify clusters of stocks with varying degrees of correlation. |
| Computational Complexity | Generally more computationally efficient as it assigns each data point to a single cluster. In trading, this could involve grouping stocks into clusters efficiently, making it easier to analyse and make investment decisions. | Can be computationally intensive for large datasets, especially when forming the dendrogram. However, it offers a visual representation that can be valuable for understanding relationships among data points. For instance, you might use hierarchical clustering to create a visual representation of how different stocks are related in terms of price movements. |
| Cluster Shape | Assumes clusters are spherical, which may not be suitable for data with complex shapes. For example, if stocks have non-linear relationships, K-means might struggle to accurately capture them. | Can handle clusters of various shapes, making it more adaptable to complex structures. In trading, where relationships between stocks can be intricate, hierarchical clustering might provide a more nuanced view of how stocks are grouped. |
| Interpretability | May lack interpretability for complex data, as it focuses on assigning points to clusters without explicitly showing relationships. For instance, K-means might group stocks based on volatility, but the underlying reasons for the grouping may not be immediately clear. | Offers interpretability through the dendrogram, providing a visual representation of relationships among data points. This can be particularly beneficial in trading, where understanding how stocks are hierarchically grouped can inform investment strategies based on correlations. |
Stay tuned for Part II to learn about the hierarchical clustering key concepts.
Originally posted on QuantInsti blog.
Disclosure: Interactive Brokers
Information posted on IBKR Campus that is provided by third-parties does NOT constitute a recommendation that you should contract for the services of that third party. Third-party participants who contribute to IBKR Campus are independent of Interactive Brokers and Interactive Brokers does not make any representations or warranties concerning the services offered, their past or future performance, or the accuracy of the information provided by the third party. Past performance is no guarantee of future results.
This material is from QuantInsti and is being posted with its permission. The views expressed in this material are solely those of the author and/or QuantInsti and Interactive Brokers is not endorsing or recommending any investment or trading discussed in the material. This material is not and should not be construed as an offer to buy or sell any security. It should not be construed as research or investment advice or a recommendation to buy, sell or hold any security or commodity. This material does not and is not intended to take into account the particular financial conditions, investment objectives or requirements of individual customers. Before acting on this material, you should consider whether it is suitable for your particular circumstances and, as necessary, seek professional advice.
Join The Conversation
If you have a general question, it may already be covered in our FAQs. If you have an account-specific question or concern, please reach out to Client Services.